Thursday, November 5, 2015

SPX Straddle - 80 DTE - Results Summary

Over the last five blog posts we looked at the automated backtest results for 4040 options straddles sold on the S&P 500 Index (SPX) at 80 days-to-expiration (DTE).  Eight different loss approaches were tested on these straddles.  On top of these eight loss approaches, tests were conducted with no profit taking, and profit taking at 10%, 25%, 35%, and 45% of the credit received.

For background information associated with the results in this post, please see the following posts:


The results in this post are summarized in six heat map tables.  In these tables, each row corresponds to a different loss exit percentage.  For example, the first row (25) corresponds to the strategy variations where losses were taken at 25% of the credit received.  These rows have values from 25 to 200.  The columns are a little more complicated, and are grouped first by implied volatility rank (IVR) level, and then by profit exit percentage.  You can see that each IVR percentage level contains five columns (10, 25, 35, 45, and NA)...with each column representing a profit taking percentage.  For example, the first column lists all of the strategy variations where the IVR was less than 25% and profits were taken at 10% of the credit received.

The first table shows the average normalized P&L per day by IVR, profit taking percentage, and loss taking percentage. The highest daily returns are concentrated in the IVR > 50% columns, specifically profit taking at 25%, 35%, 45%, and NA.  The 45% profit taking level was clearly the strongest.  So far, the highest P&L per day readings occurred with the 45 DTE variations at 25% and 35% profit taking.  The best 80 DTE reading (1.64%) was the highest across all DTE variations.

80 DTE SPX Short Straddle Summary Normalized Percent P&L Per Day
(click to enlarge)

The second table shows the average P&L per trade by IVR, profit taking percentage, and loss taking percentage.  The area with the highest P&L per trade values was IVR > 50%, profit taking at 45%, and no profit management (NA).  Also, as we noticed in the 59 DTE summary post, the trade returns in the IVR < 25% section with profit management at 25%, 35%, and 45% are very good.  The returns in this section at 80 DTE are very strong, and second only to the corresponding section at 66 DTE.

80 DTE SPX Short Straddle Summary Normalized Percent P&L Per Trade
(click to enlarge)

The third table shows the win percent / win rate by IVR, profit taking percentage, and loss taking percentage.  The highest win rates occur at lower profit taking levels...the lower the profit taking percentage, the higher the win rate for a given IVR grouping.  This highest individual win rates (95%) occur with an IVR > 50% and profit taking at 10%.  This section was also the strongest for the 45 DTE and 59 DTE trade variations.

80 DTE SPX Short Straddle Summary Win Rate
(click to enlarge)

In the fourth table, we see the Sortino Ratio by IVR, profit taking percentage, and loss taking percentage.  The highest Sortino Ratios were associated with loss taking at 25% and an IVR > 50%.  The best Sortinos at 80 DTE were lower than the best Sortinos at all other DTE except for 52 DTE.

80 DTE SPX Short Straddle Summary Sortino Ratio
(click to enlarge)

The fifth table shows the profit factor by IVR, profit taking percentage, and loss taking percentage.  The largest profit factor values were associated with an IVR > 50%, profit taking at 35%, 45%, and NA, across loss taking levels.

80 DTE SPX Short Straddle Summary Profit Factor
(click to enlarge)

The last table shows the average days-in-trade (DIT) by IVR, profit taking percentage, and loss taking percentage.  The quicker the profit taking, the shorter the time spent in a trade.  Limiting your losses to 25% of the credit received also took you out of the trades sooner.

80 DTE SPX Short Straddle Summary Days In Trade
(click to enlarge)

Which variation of the 80 DTE straddle is best?  That depends on your risk tolerance.  If I was going to trade a 80 DTE ATM SPX straddle on a monthly basis, I would gravitate towards the non-IVR filtered version that takes profits at 25% and losses around 100%.  If I just wanted to trade these more opportunistically, then I would look for trades when the IVR is greater than 50%, and manage with profit taking at 35% and loss taking at 100%.  You can find links to all of my SPX straddle articles on the SPX Straddle Summary Page.

In the next one or two posts I will summarize the results of all of the SPX short straddle backtests.


Follow my blog by email, RSS feed or Twitter (@DTRTrading).  All options are available on the top of the right hand navigation column under the headings "Subscribe To RSS Feed", "Follow By Email", and "Twitter".

Wednesday, November 4, 2015

SPX Straddle - 80 DTE - Manage Profits at 45%

In this post we look at the backtest results of selling a one-lot, at-the-money (ATM) straddle on the S&P 500 Index (SPX), initiated at 80 days-to-expiration (DTE).  In this fifth post of five on 80 DTE straddles, we look at trades that use the same loss exits as shown in the first post, and in addition, take profits at 45% of the credit received.  The results displayed in this post represent data from 832 individual trades entered by the automated backtester.

For background on the setup for the backtests, as well as the nomenclature used in the charts and tables below, please see the introductory article for this series: Option Straddle Series - P&L Exits.

In the trade metrics tables, some of the metrics rows have been highlighted to indicate values that are in the upper half of the readings.  One of the metrics to note is the average P&L per day in percentage terms (P&L % / Trade - Avg. P&L / Day).  This is a measure of the P&L per day normalized to the maximum initial portfolio margin (initial PM) required for that trade run...it tells us the effectiveness of theta with respect to our margin requirement.  Also note that the y-axis scale is the same in all of the 80 DTE equity curves.


No IV Rank Filter

In this section we look at the results of entering one trade for every monthly expiration regardless of the implied volatility rank (IVR) of the SPX on the date of entry.  Entering these trades at 80 DTE and utilizing our loss exits and 45% credit exits (described here), resulted in the equity curves below.

SPX Short Options Straddle Equity Curves - 80 DTE - Risk:Reward 45% Exits
(click to enlarge)

The trade metrics for these different exits are shown in the table below.  The (100:45) variation stood out with the best P&L % / day reading, the highest P&L % per trade reading, the highest total P&L % value, and the highest win rate (of 70%).  Five other variations also had win rates of 70%.

SPX Short Options Straddle Trade Metrics - 80 DTE - Risk:Reward 45% Exits
(click to enlarge)

The table below shows the distribution of returns in five-number summary format.  Hat-tip to tastytrade.

SPX Short Options Straddle 5 Number Summary - 80 DTE - Risk:Reward 45% Exits
(click to enlarge)

Below are three sets of scatter plots for selling 80 DTE ATM SPX straddles. The first image contains one scatter plot per strategy and shows P&L in percentage terms versus IVR for the SPX. The IVR was captured on the day each trade was initiated.  The trend of increasing P&L with increasing IVR is very clear.

SPX Short Options Straddle Scatter Plot IV Rank versus P&L - 80 DTE - Risk:Reward 45% Exits
(click to enlarge)

The next image shows P&L in percentage terms versus initial ATM IV. This ATM IV was captured on the day each trade was initiated.  Higher IV resulted in higher returns, but the majority of the profitable and unprofitable trades occurred at lower IV...below 30.

SPX Short Options Straddle Scatter Plot IV versus P&L - 80 DTE - Risk:Reward 45% Exits
(click to enlarge)

The third image shows P&L in percentage terms versus days-in-trade (DIT).  In order to extract 45% of the credit, the trade duration needs to be longer...this is clearly evident with the clustering of profitable trades above 45 DIT.  At the higher loss management levels, 100% and greater, most of the losses were realized at expiration.  At these loss levels there were 29 losers out of 101 trades...a 70% win rate.

SPX Short Options Straddle Scatter Plot DIT versus P&L - 80 DTE - Risk:Reward 45% Exits
(click to enlarge)


IV Rank > 50% Filter

In this section we will look at the results of entering one trade for every monthly expiration only when the IVR of the SPX is greater than 50% ( >50% ).  Entering these trades at 80 DTE and utilizing our loss exits and 45% credit exits (described here) resulted in the equity curves below.  These are the second best returns for the 45% credit exit for all of the DTE tested up to this point...the 73 DTE were the best.

SPX Short Options Straddle Equity Curves - 80 DTE - IV Rank > 50 - Risk:Reward 45% Exits
(click to enlarge)

The trade metrics for these different exits are shown in the table below.  As we've seen with the earlier articles, there are significantly fewer trades that meet the >50% IVR criteria...19 out of 101 possible trades.  The top variations (highlighted in yellow) had higher P&L% per day readings, higher P&L% per trade values, better win rates and larger profit factors than the non-IVR filtered variations.  The best performer of the group was the (200:45) variation, although the (100:45) variation was also a strong performer.

SPX Short Options Straddle Trade Metrics - 80 DTE - IV Rank > 50 - Risk:Reward 45% Exits
(click to enlarge)

The table below shows the distribution of returns in five-number summary format.

SPX Short Options Straddle 5 Number Summary - 80 DTE - IV Rank > 50 - Risk:Reward 45% Exits
(click to enlarge)


IV Rank < 50% Filter

In this section we will look at the results of entering one trade for every monthly expiration only when the IVR of the SPX is less than 50% ( <50% ).  Entering these trades at 80 DTE and utilizing our loss exits and 45% credit exits (described here) resulted in the equity curves below.  These filtered trades have had a very good run all of 2015, but starting as early as mid-2014...this is a familiar patter for this IVR filter level.

SPX Short Options Straddle Equity Curves - 80 DTE - IV Rank < 50 - Risk:Reward 45% Exits
(click to enlarge)

The trade metrics for these different exits are shown in the table below.  Using the lower IVR filter did not improve any of the metrics.  The best performer of the group was the (100:45) variation.

SPX Short Options Straddle Trade Metrics - 80 DTE - IV Rank < 50 - Risk:Reward 45% Exits
(click to enlarge)

The table below shows the distribution of returns in five-number summary format.

SPX Short Options Straddle 5 Number Summary - 80 DTE - IV Rank < 50 - Risk:Reward 45% Exits
(click to enlarge)

In the next post I'll summarize the automated backtest results of the 80 DTE ATM SPX short straddles.


Follow my blog by email, RSS feed or Twitter (@DTRTrading).  All options are available on the top of the right hand navigation column under the headings "Subscribe To RSS Feed", "Follow By Email", and "Twitter".

Tuesday, November 3, 2015

SPX Straddle - 80 DTE - Manage Profits at 35%

In this post we look at the backtest results of selling a one-lot, at-the-money (ATM) straddle on the S&P 500 Index (SPX), initiated at 80 days-to-expiration (DTE).  In this fourth post of five on 80 DTE straddles, we look at trades that use the same loss exits as shown in the first post, and in addition, take profits at 35% of the credit received.  The results displayed in this post represent data from 808 individual trades entered by the automated backtester.

For background on the setup for the backtests, as well as the nomenclature used in the charts and tables below, please see the introductory article for this series: Option Straddle Series - P&L Exits.

In the trade metrics tables, some of the metrics rows have been highlighted to indicate values that are in the upper half of the readings.  One of the metrics to note is the average P&L per day in percentage terms (P&L % / Trade - Avg. P&L / Day).  This is a measure of the P&L per day normalized to the maximum initial portfolio margin (initial PM) required for that trade run...it tells us the effectiveness of theta with respect to our margin requirement.  Also note that the y-axis scale is the same in all of the 80 DTE equity curves.


No IV Rank Filter

In this section we will look at the results of entering one trade for every monthly expiration regardless of the implied volatility rank (IVR) of the SPX on the date of entry.  Entering these trades at 80 DTE and utilizing our loss exits and 35% credit exits (described here), resulted in the equity curves below.  Because of the larger profit taking, these curves are not smooth, and are similar to other 35% profit taking variations at lower DTE.

SPX Short Options Straddle Equity Curves - 80 DTE - Risk:Reward 35% Exits
(click to enlarge)

The trade metrics for these different exits are shown in the table below.  The (100:35) variation stands out with the highest P&L % per day reading, highest P&L % per trade value, highest total P&L %, and highest win rate (of 73%).  Five of the eight variations had win rates of 73%.

SPX Short Options Straddle Trade Metrics - 80 DTE - Risk:Reward 35% Exits
(click to enlarge)

The table below shows the distribution of returns in five-number summary format.  Hat-tip to tastytrade.

SPX Short Options Straddle 5 Number Summary - 80 DTE - Risk:Reward 35% Exits
(click to enlarge)

Below are three sets of scatter plots for selling 80 DTE ATM SPX straddles. The first image contains one scatter plot per strategy and shows P&L in percentage terms versus IVR for the SPX. The IVR was captured on the day each trade was initiated.  As we noticed in the prior articles, there is a very obvious trend of increasing P&L with increasing IVR.

SPX Short Options Straddle Scatter Plot IV Rank versus P&L - 80 DTE - Risk:Reward 35% Exits
(click to enlarge)


The next image shows P&L in percentage terms versus initial ATM IV. This ATM IV was captured on the day each trade was initiated.  Higher IV resulted in higher returns, but the majority of the profitable and unprofitable trades occurred at lower IV...below 30.

SPX Short Options Straddle Scatter Plot IV versus P&L - 80 DTE - Risk:Reward 35% Exits
(click to enlarge)

The third image shows P&L in percentage terms versus days-in-trade (DIT).  We see the same two patterns that we observed in the prior articles...when managing losses early (25%,  50%), the losses were fairly evenly distributed across DIT.  As the loss management becomes less aggressive (75% and higher), we see that the losses are concentrated later in the trades.  Also, as we've seen in the other posts, most of these losses were not realized until expiration...meaning that many of these particular losses were less than our loss threshold values.  In order to collect 35% of the credit, you had to stay in these trades longer...about 35 days before you start taking profits.

SPX Short Options Straddle Scatter Plot DIT versus P&L - 80 DTE - Risk:Reward 35% Exits
(click to enlarge)


IV Rank > 50% Filter

In this section we will look at the results of entering one trade for every monthly expiration only when the IVR of the SPX is greater than 50% ( >50% ).  Entering these trades at 80 DTE and utilizing our loss exits and 35% credit exits (described here) resulted in the equity curves below.

SPX Short Options Straddle Equity Curves - 80 DTE - IV Rank > 50 - Risk:Reward 35% Exits
(click to enlarge)

The trade metrics for these different exits are shown in the table below.  As we've seen in the earlier articles, only about 20% of the trades meet the >50% IVR criteria.  The best variation of the group was the (200:35) straddle, followed by the (100:35) straddle.  The win rate was 89% for five of the eight variations.

SPX Short Options Straddle Trade Metrics - 80 DTE - IV Rank > 50 - Risk:Reward 35% Exits
(click to enlarge)

The table below shows the distribution of returns in five-number summary format.

SPX Short Options Straddle 5 Number Summary - 80 DTE - IV Rank > 50 - Risk:Reward 35% Exits
(click to enlarge)


IV Rank < 50% Filter

In this section we will look at the results of entering one trade for every monthly expiration only when the IVR of the SPX is less than 50% ( <50% ).  Entering these trades at 80 DTE and utilizing our loss exits and 35% credit exits (described here) resulted in the equity curves below.

SPX Short Options Straddle Equity Curves - 80 DTE - IV Rank < 50 - Risk:Reward 35% Exits
(click to enlarge)

The trade metrics for these different exits are shown in the table below.  The metrics for these IVR filtered variations were slightly worse than the unfiltered variations.  The top performing strategies were the (100:35) and (175:35) variations.

SPX Short Options Straddle Trade Metrics - 80 DTE - IV Rank < 50 - Risk:Reward 35% Exits
(click to enlarge)

The table below shows the distribution of returns in five-number summary format.

SPX Short Options Straddle 5 Number Summary - 80 DTE - IV Rank < 50 - Risk:Reward 35% Exits
(click to enlarge)

In the next post we will look at the backtest results of 80 DTE ATM SPX short straddles using the same loss thresholds as above, but with profit taking occurring at 45% of the credit received.


Follow my blog by email, RSS feed or Twitter (@DTRTrading).  All options are available on the top of the right hand navigation column under the headings "Subscribe To RSS Feed", "Follow By Email", and "Twitter".

Monday, November 2, 2015

SPX Straddle - 80 DTE - Manage Profits at 25%

In this post we look at the backtest results of selling a one-lot, at-the-money (ATM) straddle on the S&P 500 Index (SPX), initiated at 80 days-to-expiration (DTE).  In this third post of five on 80 DTE straddles, we look at trades that use the same loss exits as shown in the first post, and in addition, take profits at 25% of the credit received.  The results displayed in this post represent data from 808 individual trades entered by the automated backtester.

For background on the setup for the backtests, as well as the nomenclature used in the charts and tables below, please see the introductory article for this series: Option Straddle Series - P&L Exits.

In the trade metrics tables, some of the metrics rows have been highlighted to indicate values that are in the upper half of the readings.  One of the metrics to note is the average P&L per day in percentage terms (P&L % / Trade - Avg. P&L / Day).  This is a measure of the P&L per day normalized to the maximum initial portfolio margin (initial PM) required for that trade run...it tells us the effectiveness of theta with respect to our margin requirement.  Also note that the y-axis scale is the same in all of the 80 DTE equity curves.


No IV Rank Filter

In this section we will look at the results of entering one trade for every monthly expiration regardless of the implied volatility rank (IVR) of the SPX on the date of entry.  Entering these trades at 80 DTE and utilizing our loss exits and 25% credit exits (described here), resulted in the equity curves below...similar in total returns to the corresponding 59 DTE and 73 DTE variations that managed profits at 25%.

SPX Short Options Straddle Equity Curves - 80 DTE - Risk:Reward 25% Exits
(click to enlarge)

The trade metrics for these different exits are shown in the table below.  The (100:25) variation stands out with the top P&L % per day reading, highest overall P&L % value, highest P&L % per trade, highest win rate, and largest total P&L.

SPX Short Options Straddle Trade Metrics - 80 DTE - Risk:Reward 25% Exits
(click to enlarge)

The table below shows the distribution of returns in five-number summary format.  Hat-tip to Tastytrade.

SPX Short Options Straddle 5 Number Summary - 80 DTE - Risk:Reward 25% Exits
(click to enlarge)

Below are three sets of scatter plots for selling 80 DTE ATM SPX straddles. The first image contains one scatter plot per strategy and shows P&L in percentage terms versus IVR for the SPX. The IVR was captured on the day each trade was initiated.  The trend of increasing P&L with increasing IVR is clearly visible in the scatter plots.


SPX Short Options Straddle Scatter Plot IV Rank versus P&L - 80 DTE - Risk:Reward 25% Exits
(click to enlarge)

The next image shows P&L in percentage terms versus initial ATM IV. This ATM IV was captured on the day each trade was initiated.  Higher IV resulted in higher returns, but the majority of the profitable trades occurred at an IV below 40.  The majority of the losing trades occurred below an IV of 30.

SPX Short Options Straddle Scatter Plot IV versus P&L - 80 DTE - Risk:Reward 25% Exits
(click to enlarge)

The third image shows P&L in percentage terms versus days-in-trade (DIT).  We see the same two patterns that we observed before...when managing losses early (25%, 50%), the losses were fairly evenly distributed across DIT.  As the loss management becomes less aggressive (125% and higher), we see that most of the losses were not realized until expiration...meaning many of these particular losses were less than our threshold values.  Also, for this particular DTE and profit management level, profitable trades generally occurred anywhere from 20 to 60 days.

SPX Short Options Straddle Scatter Plot DIT versus P&L - 80 DTE - Risk:Reward 25% Exits
(click to enlarge)


IV Rank > 50% Filter

In this section we will look at the results of entering one trade for every monthly expiration only when the IVR of the SPX is greater than 50% ( >50% ).  Entering these trades at 80 DTE and utilizing our loss exits and 25% credit exits (described here) resulted in the equity curves below.

SPX Short Options Straddle Equity Curves - 80 DTE - IV Rank > 50 - Risk:Reward 25% Exits
(click to enlarge)

The trade metrics for these different exits are shown in the table below.  There are significantly fewer trades that meet the >50% IVR criteria...slightly less than 20% of the available trades...this is a consistent trend with the > 50% IVR filter.  Using this IVR filter, causes five of the eight strategy variations to have win rates of 89%.  The (200:25) and (100:25) variations were the best performers of the eight strategies.

SPX Short Options Straddle Trade Metrics - 80 DTE - IV Rank > 50 - Risk:Reward 25% Exits
(click to enlarge)

The table below shows the distribution of returns in five-number summary format.

SPX Short Options Straddle 5 Number Summary - 80 DTE - IV Rank > 50 - Risk:Reward 25% Exits
(click to enlarge)


IV Rank < 50% Filter

In this section we will look at the results of entering one trade for every monthly expiration only when the IVR of the SPX is less than 50% ( <50% ).  Entering these trades at 80 DTE and utilizing our loss exits and 25% credit exits (described here) resulted in the equity curves below.

SPX Short Options Straddle Equity Curves - 80 DTE - IV Rank < 50 - Risk:Reward 25% Exits
(click to enlarge)

The trade metrics for these different exits are shown in the table below.  The metrics for the variations associated with this lower IVR filter were not as good as either the non-IVR filtered strategies or the IVR > 50% strategies.

SPX Short Options Straddle Trade Metrics - 80 DTE - IV Rank < 50 - Risk:Reward 25% Exits
(click to enlarge)

The table below shows the distribution of returns in five-number summary format.

SPX Short Options Straddle 5 Number Summary - 80 DTE - IV Rank < 50 - Risk:Reward 25% Exits
(click to enlarge)

In the next post we will look at the backtest results of 80 DTE ATM SPX short straddles using the same loss thresholds as above, but with profit taking occurring at 35% of the credit received.


Follow my blog by email, RSS feed or Twitter (@DTRTrading).  All options are available on the top of the right hand navigation column under the headings "Subscribe To RSS Feed", "Follow By Email", and "Twitter".

Sunday, November 1, 2015

SPX Straddle - 80 DTE - Manage Profits at 10%

In this post we look at the backtest results of selling a one-lot, at-the-money (ATM) straddle on the S&P 500 Index (SPX), initiated at 80 days-to-expiration (DTE).  In this second post of five on 80 DTE straddles, we look at trades that use the same loss exits as shown in the first post, and in addition, take profits at 10% of the credit received.  The results displayed in this post represent data from 808 individual trades entered by the automated backtester.

For background on the setup for the backtests, as well as the nomenclature used in the charts and tables below, please see the introductory article for this series: Option Straddle Series - P&L Exits.

In the trade metrics tables, some of the metrics rows have been highlighted to indicate values that are in the upper half of the readings.  One of the metrics to note is the average P&L per day in percentage terms (P&L % / Trade - Avg. P&L / Day).  This is a measure of the P&L per day normalized to the maximum initial portfolio margin (initial PM) required for that trade run...it tells us the effectiveness of theta with respect to our margin requirement.  Also note that the y-axis scale is the same in all of the 80 DTE equity curves.


No IV Rank Filter

In this section we will look at the results of entering one trade for every monthly expiration regardless of the implied volatility rank (IVR) of the SPX on the date of entry.  Entering these trades at 80 DTE and utilizing our loss exits and 10% credit exits (described here), resulted in the equity curves below.  Many of these equity curves experienced a sharp drop during the 2008 financial crisis, especially the less aggressive loss management variations.  On the other hand, these less aggressive loss management strategies have had very minor drawdowns since 2008.

SPX Short Options Straddle Equity Curves - 80 DTE - Risk:Reward 10% Exits
(click to enlarge)

The trade metrics for these different exits are shown in the table below.  Six of the eight variations have win rates at 90% or greater.  The (50:10) variation seems to be the best in the group.  It had the second highest P&L % / day reading, highest P&L / trade reading, highest overall P&L % value, and a win rate of 89%.  There were other variations that had better individual metrics, but the (50:10) seems to have the best mix.  Also, in terms of win rate, the (50:10) had 11 losing trades compared to the best variations with only 9 losing trades.

SPX Short Options Straddle Trade Metrics - 80 DTE - Risk:Reward 10% Exits
(click to enlarge)

The table below shows the distribution of returns in five-number summary format.  Hat-tip to tastytrade.

SPX Short Options Straddle 5 Number Summary - 80 DTE - Risk:Reward 10% Exits
(click to enlarge)

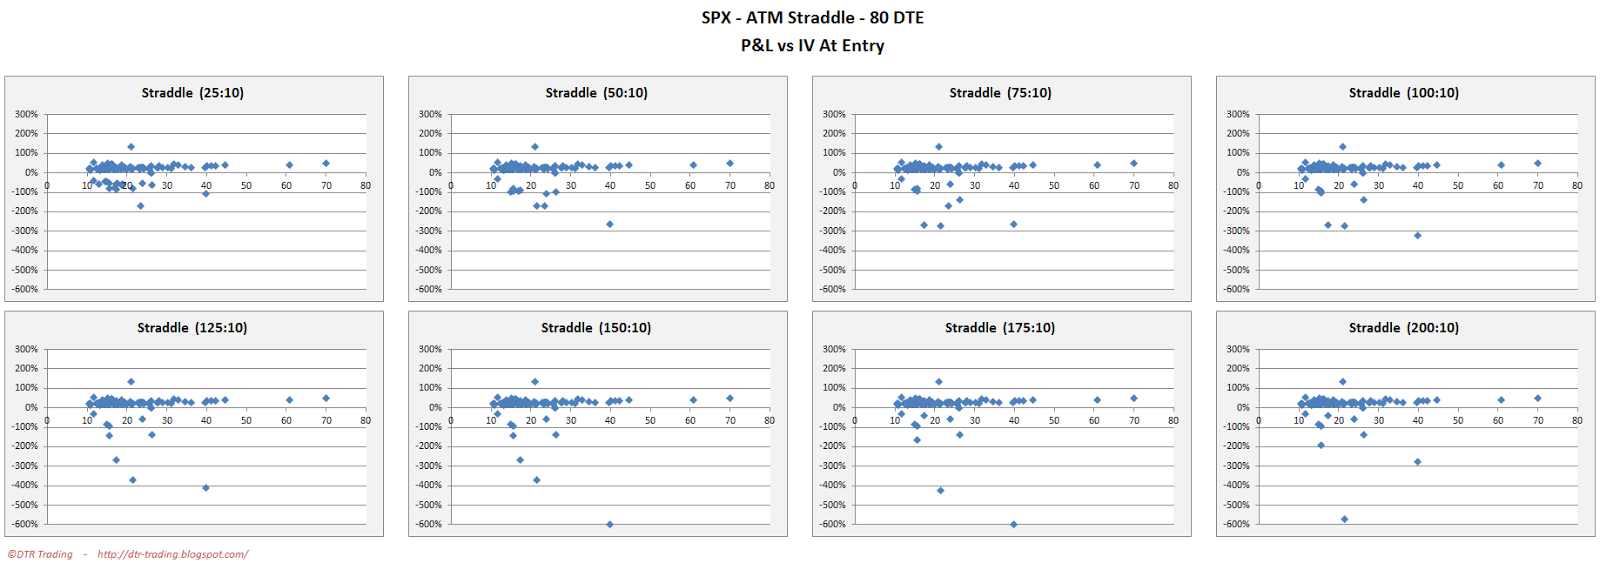
Below are three sets of scatter plots for selling 80 DTE ATM SPX straddles. The first image contains one scatter plot per strategy and shows P&L in percentage terms versus IVR for the SPX. The IVR was captured on the day each trade was initiated.  There is a trend of increasing P&L with increasing IVR, but it is not very clear because the y-axis scale.  This is the same y-axis scale used in the first post of this 80 DTE short straddle series.

SPX Short Options Straddle Scatter Plot IV Rank versus P&L - 80 DTE - Risk:Reward 10% Exits
(click to enlarge)

The next image shows P&L in percentage terms versus initial ATM IV. This ATM IV was captured on the day each trade was initiated.  Higher IV resulted in higher returns, but the majority of all trades occurred at lower IV, below 40.  The bulk of the losing trades occurred at an IV below 30, but many winning trades occurred in this region as well.  Also, the number of losing trades in this region decreases as the loss taking threshold is increased.  At loss management levels of 100% and greater, the number of losing trades remained constant at 9.

SPX Short Options Straddle Scatter Plot IV versus P&L - 80 DTE - Risk:Reward 10% Exits
(click to enlarge)

The third image shows P&L in percentage terms versus days-in-trade (DIT).  When managing losses early (25%, 50%), the losses were fairly evenly distributed across DIT...we've seen this pattern with every DIT scatter plot.  As the loss management becomes less aggressive (75%, 100%, 125%, 150%, 175%, and 200%), the loss thresholds were hit in less than 5% of the trades.  There were still additional losing trades, but these losses were realized at expiration.  Also, these losses were mostly less than our threshold value at expiration.

SPX Short Options Straddle Scatter Plot DIT versus P&L - 80 DTE - Risk:Reward 10% Exits
(click to enlarge)


IV Rank > 50% Filter

In this section we look at the results of entering one trade for every monthly expiration only when the IVR of the SPX is greater than 50% ( >50% ).  Entering these trades at 80 DTE and utilizing our loss exits and 10% credit exits (described here) resulted in the equity curves below...not great...better than some, and worse than others.  In general, this IVR filter does not work well with profit taking at 10% across DTE and loss management levels.

SPX Short Options Straddle Equity Curves - 80 DTE - IV Rank > 50 - Risk:Reward 10% Exits
(click to enlarge)

The trade metrics for these different exits are shown in the table below.  As weve' seen, there are significantly fewer trades that meet the >50% IVR criteria...in this case only 19 out of 101.  The win rate was very good (at 95%) for five of the eight variations, but the total P&L % numbers were low.

SPX Short Options Straddle Trade Metrics - 80 DTE - IV Rank > 50 - Risk:Reward 10% Exits
(click to enlarge)

The table below shows the distribution of returns in five-number summary format.

SPX Short Options Straddle 5 Number Summary - 80 DTE - IV Rank > 50 - Risk:Reward 10% Exits
(click to enlarge)


IV Rank < 50% Filter

In this section we will look at the results of entering one trade for every monthly expiration only when the IVR of the SPX is less than 50% ( <50% ).  Entering these trades at 80 DTE and utilizing our loss exits and 10% credit exits (described here) resulted in the equity curves below...which look significantly better than the IVR > 50% equity curves.  They have the same drawdown percentage, but higher total returns.

SPX Short Options Straddle Equity Curves - 80 DTE - IV Rank < 50 - Risk:Reward 10% Exits
(click to enlarge)

The trade metrics for these different exits are shown in the table below.  The top performer was the (50:10) variation, even though it had the second lowest win rate of the group.  This variation had the second highest P&L per day reading, the highest P&L per trade value, and the largest overall P&L.  Six of the eight variations had win rates of 90%.

SPX Short Options Straddle Trade Metrics - 80 DTE - IV Rank < 50 - Risk:Reward 10% Exits
(click to enlarge)

The table below shows the distribution of returns in five-number summary format.

SPX Short Options Straddle 5 Number Summary - 80 DTE - IV Rank < 50 - Risk:Reward 10% Exits
(click to enlarge)

In the next post we will look at the backtest results of 80 DTE ATM SPX short straddles using the same loss thresholds as above, but with profit taking occurring at 25% of the credit received.


Follow my blog by email, RSS feed or Twitter (@DTRTrading).  All options are available on the top of the right hand navigation column under the headings "Subscribe To RSS Feed", "Follow By Email", and "Twitter".