Wednesday, January 13, 2016

RUT Straddle - Backtest Results Summary

Over the last seven weeks we reviewed the backtest results of 28,840 short options straddles on the Russell 2000 Index (RUT).  In this post, I won't discuss how these trades were structured and managed. For background on the setup for the backtests, as well as the nomenclature used in the charts and tables below, please see the introductory article for this series: Option Straddle Series - P&L Exits.

At a high level, we tested 7 different days-to-expiration (DTE) for trade entry.  For each of these DTE, we tested 8 different loss management levels (based on the credit received for selling the straddle).  For each of these loss management levels, we tested 5 different profit management levels, again based on the credit received for selling the straddle.  This comes out to 280 different tests for each monthly option expiration  (7 x 8 x 5 = 280).  We backtested all of the monthly options expirations starting in January 2007 and running through August 2015...a few more than 100 monthly options expirations...and that's how we got to the 28,840 trades.  This does not include the 5 IVR filters that were tested (no filter, >25, <25, >50, <50) ... If I did, we'd need to multiply the 28,840 by 5.


Equity Curves
Enough of the intro, let's get into the results.  Just like I've done in my prior full-summary posts, I'm including equity curves for each of the DTE.  In the images below, each row is a separate DTE, starting with 38 DTE at the top, and ending with 80 DTE at the bottom.  I am only including three profit taking levels (10%, 25%, and 35%) in order to fit a representative number of equity curves in this post.  Also, note that the y-axis is the same across all 21 of the equity curves below.


RUT Short Straddle Curves 59 to 73 DTE, Risk:Reward Exits
RUT Short Straddle Curves 38 to 52 DTE, Risk:Reward Exits
RUT Short Straddle Curves 80, Risk:Reward Exits
(click to enlarge)

So what can we learn from these equity curves...essentially the same things we learned from the SPX straddle equity curves. The trades with higher profit taking levels had the greatest returns for a given DTE.  Also, the trades with the longer durations (higher DTE), in general had greater returns for a given profit taking level.


General Trends
For the RUT short option straddle articles I chose not to share the scatter plots.  The trends that we noticed in the scatter plots for the SPX short option straddles were also present in the scatter plots for the RUT short option straddles.  If you have an interest in seeing a particular scatter plot, let me know and I'll see what I can do...nothing very different from the SPX scatters though.

IV / IVR Scatter Plots
The higher the IV, or IVR, the larger the returns for a given trade.  Our profit taking is tied to the credit received, and a higher IV or IVR will result in a larger credit compared to a trade entered at a lower IV or IVR.  This also has an impact on our expiration break-even points for the trade, with a higher IV or IVR pushing our expiration break-even points further away from ATM.

IV Scatter Plots
Many trades were entered at an IV level between 15 and 40...both winning and losing trades.  This also makes sense considering the range of the RVX.

DIT Scatter Plots
Another recurring pattern was that higher DTE and/or higher profit taking percentage, resulted in longer trade durations.  This was expected, but it was nice to see that the data confirmed our intuition.

IVR Filtering
The most consistent IVR patterns were related to the IVR > 50% filter.  In general, trades that met the IVR > 50% criteria had higher win rates, higher P&L readings, and higher profit factors.  The downside?  ...only about 20% of all potential trades met this IVR criteria ... so, only two or three trades per year.  When you do see this filter criteria met, you should strongly consider increasing your size for these RUT short straddles.


Quantitative Results
In all of the tables below, I followed the same structure as the tables in the summary posts for the individual DTE.  The only difference is that the heat map coloring below evaluates all of the data, so that we can visualize the strength of IVR filters, profit taking levels, and loss taking levels across the entire data set.

The first table shows the normalized percent P&L per day for all of the strategy variations.  The variations that met the IVR > 50% filter had the highest readings.  The highest readings for this group occurred at 73 DTE, with loss taking at 75% or greater, and profit taking ranging from 25% to 45%.  As I mentioned above, you were only able to enter these IVR > 50% trades two or three times per year ... only two or three times per year did we see a RUT IVR level greater than 50% at trade entry.

When we evaluate these normalized P&L per day readings, we need to also consider how many days during the year we will generate these daily returns.  Using IVR to filter our trade entries will dramatically reduce our annual DIT.  Low profit taking levels and low loss taking levels will also reduce our annual DIT for a given DTE trade entry window...so all four (IVR, loss %, profit %, DTE) need to be considered when targeting a particular daily return.

RUT Short Straddle Summary Normalized Percent P&L Per Day
(click to enlarge)

The second table shows the normalized percent P&L per trade for all of the strategy variations.  Again, we see the highest per trade returns associated with the variations that met the IVR > 50% filter, with the 73 DTE variations standing out.  If we look at the non-IVR filtered variations (NA), we see return profiles similar to those of the SPX...although not quite as good.  For traders who are executing these trades every month, this is the column to focus on.
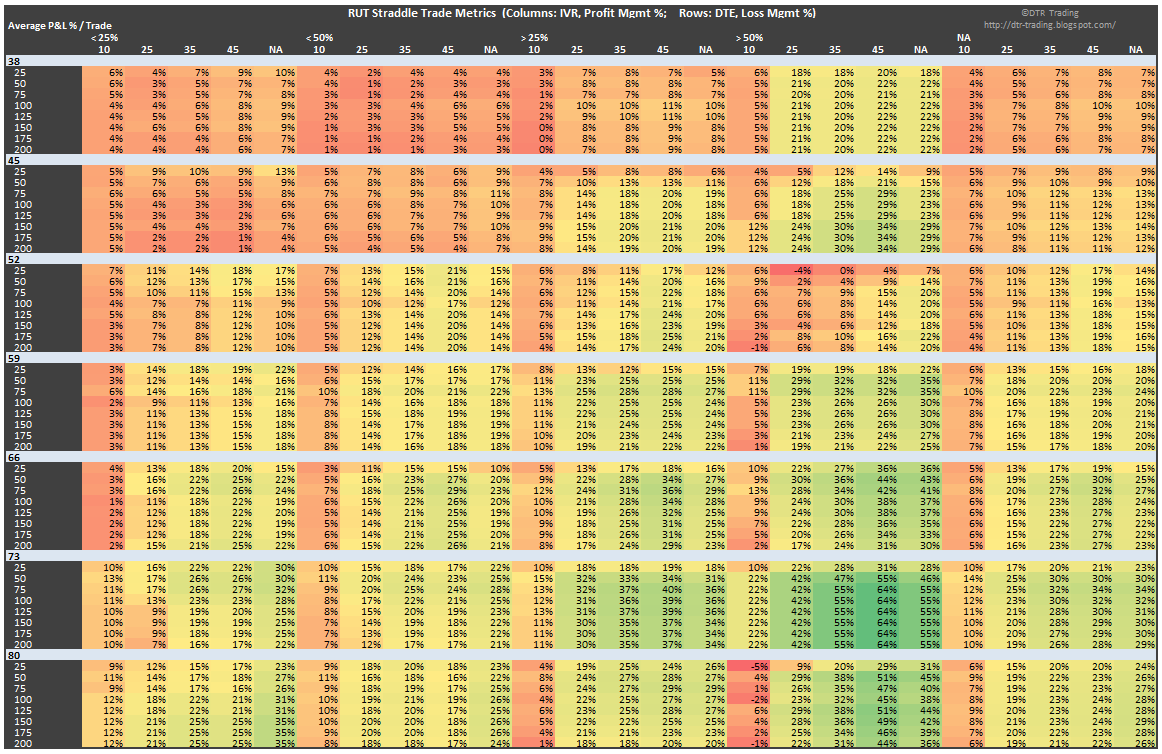
RUT Short Straddle Summary Normalized Percent P&L Per Trade
(click to enlarge)

The third table shows the win rate for all of the strategy variations.  Similar to the SPX straddles, the highest win rates occurred at the 10% profit taking level...regardless of IVR filter level.  Most of these particular win rates were in the 90% range.  For the non-IVR filtered group (NA), many of the 10% profit taking variations also had win rates in the 90% range.  For this same non-IVR filtered group, with entries from 59 DTE to 80 DTE, the 25% profit taking level was in the mid to high 80% range.  For these 25% profit taking variations, the average P&L per trade numbers were in the mid to high teens...not the highest in the table, but very good for a monthly trade.

RUT Short Straddle Summary Win Rate
(click to enlarge)

The fourth table shows Sortino Ratios for all of the strategy variations.  The extreme readings for the 73 DTE variations in the IVR > 50% group really stand out...and tend to hide other readings that would normally be good for straddles (0.45 and higher).  If we ignore this grouping, what we see are areas of strength at 59 DTE, 66 DTE, and 73 DTE at the loss taking levels of 25%, 50%, and 75% in the non-IVR filtered group (NA)...see secondary table below.

RUT Short Straddle Summary Sortino Ratio
(click to enlarge)
(click to enlarge)

The fifth table shows the profit factors for each of the strategy variations.  The extreme readings for the 73 DTE variations in the IVR > 50% group again overshadow the other results.  If we ignore the results in this grouping, we see other regions of very strong profit factors...see secondary table below.

RUT Short Straddle Summary Profit Factor
(click to enlarge)
(click to enlarge)

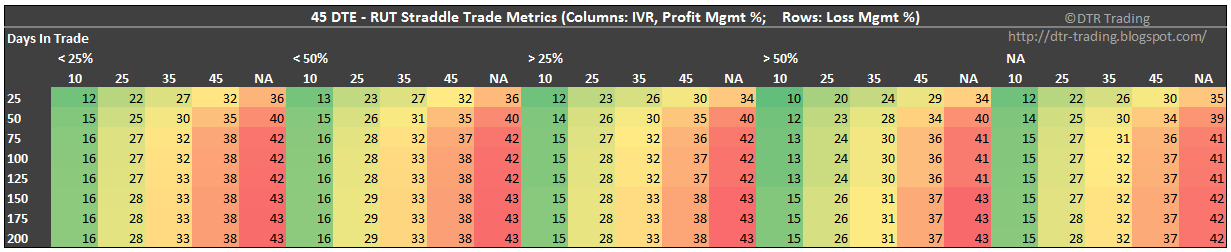
The sixth table shows days-in-trade (DIT) for each of the strategy variations.  As we've see in all of my SPX and RUT straddle articles..the quicker you take profits or losses, the shorter your trade duration.  Also, longer DTE variations required you to stay in your trades longer in order to hit your profit exit.  In general, we can see in the table that, to collect 10% of the credit received (10% profit taking level) required a trade duration of roughly 30% of the entry DTE.  At the 25% profit taking level you needed to stay in the trade around 60% of the entry DTE.  For the 35% profit taking level it was about 70% of the entry DTE; 45% profit taking took your trade duration to about 80% of the entry DTE.  These estimates are for the non-IVR filtered strategy variations and are consistent with the SPX straddle results.

RUT Short Straddle Summary Days In Trade
(click to enlarge)

The seventh table shows the number of trades that were entered for each strategy variation.  The number of trades for a particular variation, along with the DIT (previous table) have a large impact on your portfolio returns.  As soon as you apply an IVR filter to trade entry, you reduce the number of trades that you take...as seen in the table below.  These results are also consistent with the SPX straddle results.
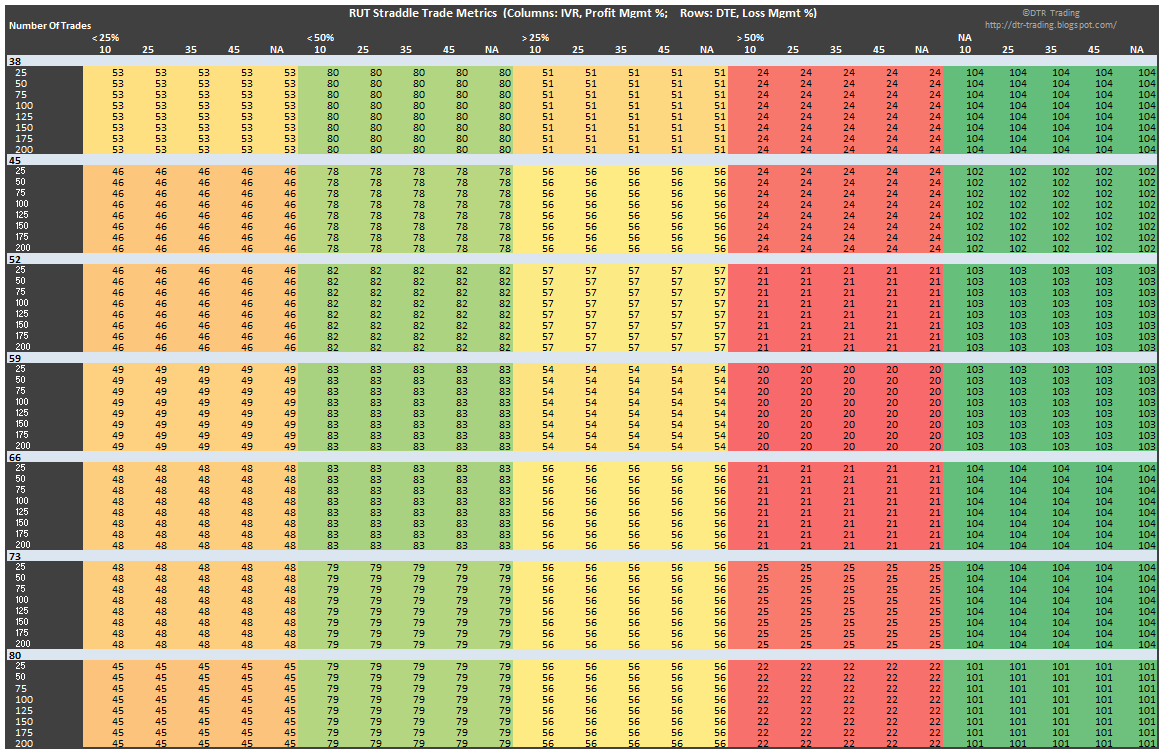
RUT Short Straddle Summary Total Trades Entered
(click to enlarge)

The last table shows the.total non-compounded normalized returns by strategy variation.  The non-IVR filtered variations had the highest returns, which is related to these variations having the most trades (100+, see table above).  In general, the trend is for higher returns with higher DTE...and is the same pattern that we noticed with the SPX straddles.

RUT Short Straddle Summary Percent Total Returns
(click to enlarge)

In the variations above, I am most interested in the non-IVR filtered strategy variations because I prefer to enter these trades monthly.  Based on a number of factors, my preferred variation is profit taking at 25%, loss taking at 75% and DTE in the 55 to 70 range.  These are the same profit taking and loss taking levels I selected for the SPX.  Another set of variations that are interesting are the 50:10 between 59 and 80 DTE...these have win rates in the 90% range.  Also note, that 2015 was an unusually good year for both RUT and SPX short straddles....don't expect this higher than normal win rate to continue.

If you want to check out the details behind the numbers shown in the tables above, take a look at my RUT Straddle Summary Page that lists links to all of the articles in the series and associated Tweets.


Follow my blog by email, RSS feed or Twitter (@DTRTrading).  All options are available on the top of the right hand navigation column under the headings "Subscribe To RSS Feed", "Follow By Email", and "Twitter". 

Wednesday, January 6, 2016

RUT Straddle - 80 DTE - Results Summary

This is the seventh article in a series looking at the automated backtest results of selling at-the-money (ATM) options straddles on the Russell 2000 index (RUT).  For background on the setup for the backtests, as well as the nomenclature used in the tables below, please see the introductory article for this series: Option Straddle Series - P&L Exits

This post reviews the backtest results for 4040 options straddles sold on the RUT at 80 days-to-expiration (DTE).  Eight different loss approaches were tested on these straddles.  On top of these eight loss approaches, tests were conducted with no profit taking, and profit taking at 10%, 25%, 35%, and 45% of the credit received.  You can find the prior RUT straddle summary posts at the links below:


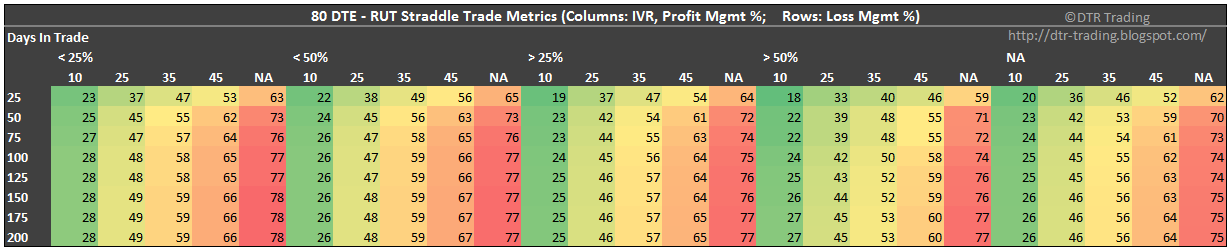
The results for these backtests are summarized in six heat map tables.  In these tables, each row corresponds to a different loss exit percentage.  For example, the first row (25) corresponds to the strategy variations where losses were taken at 25% of the credit received.  These rows have values from 25 to 200.  The columns are a little more complicated, and are grouped first by IV rank (IVR) level, and then by profit exit percentage.  You can see that each IVR percentage level contains five columns (10, 25, 35, 45, and NA)...with each column representing a profit taking percentage.  For example, the first column lists all of the strategy variations where the IVR was less than 25% and profits were taken at 10% of the credit received.

The first table shows the average normalized P&L per day by IVR, profit taking percentage, and loss taking percentage. We see the familiar pattern of the IVR > 50% level outperforming the other IVR levels in terms of P&L per day.  The highest daily returns were concentrated in the 45% profit taking level with the IVR > 50%.  The top strategy was the (50:45) variation using the IVR > 50% filter...this variation had a P&L of 0.92% per day (on initial PM).

80 DTE RUT Short Straddle Summary Normalized Percent P&L Per Day
(click to enlarge)

The second table shows the average P&L per trade by IVR, profit taking percentage, and loss taking percentage.  The IVR > 50% level had the highest P&L per trade readings, with the 45% profit taking level having the greatest strength.  The top strategies were the (50:45) and (125:45) variations using the IVR > 50% filter...these variations had a P&L of 51% per trade (on initial PM).

80 DTE RUT Short Straddle Summary Normalized Percent P&L Per Trade
(click to enlarge)

The third table shows the win percent / win rate by IVR, profit taking percentage, and loss taking percentage.  The lower the profit taking percentage, the higher the win rate for a given IVR grouping...this has been a consistent pattern for both the SPX and RUT, and across DTE.  The highest win rates occur with profit taking at 10%.  This 10% level had the highest win rates with the IVR < 25% group, with many values of 96%.  One point to note, the non-IVR filtered group, with profit taking at 10%, had many win rates of 90% or more with DTE at 45 or greater.  For example, the non filtered (50:10) variation had readings of 90% (45 DTE), 89% (52 DTE), 91% (59 DTE), 88% (66 DTE), 95% (73 DTE), and 91% (80 DTE)...very solid win rates with low risk and low profit taking.

80 DTE RUT Short Straddle Summary Win Rate
(click to enlarge)

In the fourth table, we see the Sortino Ratio by IVR, profit taking percentage, and loss taking percentage.  The Sortinos at 80 DTE show strength at the 25% and 50% loss taking levels.  The region of greatest strength is the non-IVR filtered group.  The largest value was 0.76 for the non-IVR filtered (25:NA) variation...closed at a loss of 25% of the credit received or carried to expiration.  This variation had a win rate of 56% and a P&L per trade of  24%.

80 DTE RUT Short Straddle Summary Sortino Ratio
(click to enlarge)

The fifth table shows the profit factor by IVR, profit taking percentage, and loss taking percentage. There is a region of strength in the IVR > 50% group.  The other area of strength is the IVR < 25% group, with profit taking at 10% and loss taking at 100% or greater.  The largest value was 4.4 for the (100:10), (125:10), (150:10), (175:10), and (200:10) variations in the IVR < 25% group.  These variations had win rates of 96% and P&L per trade values of 12%.

80 DTE RUT Short Straddle Summary Profit Factor
(click to enlarge)

The last table shows the average days-in-trade (DIT) by IVR, profit taking percentage, and loss taking percentage.  Quicker profit taking, translates into shorter time in the trade.

80 DTE RUT Short Straddle Summary Days In Trade
(click to enlarge)

Which variation of the 80 DTE RUT straddle is best?  If I was going to sell an 80 DTE ATM RUT straddle every month, I would go with the non-IVR filtered variation, taking profits at 25%, with a loss threshold of 50%.  This would put the lower bounds of my gains at 50% of my losses (25/50).  The win rate should be approximately 82%, profit factor at 2.3, and an average P&L per trade of 19%.

Based on all of my SPX and RUT straddle backteests, an IVR of greater than 50% occurs during only about 20% of all possible monthly trade entries.  When this occurs at a 80 DTE trade entry, I would increase my trade size,  but still trade the (50:25) variation.  During these periods of increased IVR, many of my trade metrics would improve.

You can find links to all of my RUT straddle articles, and RUT straddle tweets on the RUT Straddle Summary Page.  In the next one or two posts I will summarize the results of all of the RUT short straddle backtests.


Follow my blog by email, RSS feed or Twitter (@DTRTrading).  All options are available on the top of the right hand navigation column under the headings "Subscribe To RSS Feed", "Follow By Email", and "Twitter". 

Wednesday, December 30, 2015

RUT Straddle - 73 DTE - Results Summary

This is the sixth article in a series looking at the backtest results of selling at-the-money (ATM) options straddles on the Russell 2000 index (RUT).  For background on the setup for the backtests, as well as the nomenclature used in the tables below, please see the introductory article for this series: Option Straddle Series - P&L Exits

This post reviews the backtest results for 4160 options straddles sold on the RUT at 73 days-to-expiration (DTE).  Eight different loss approaches were tested on these straddles.  On top of these eight loss approaches, tests were conducted with no profit taking, and profit taking at 10%, 25%, 35%, and 45% of the credit received.  In the next article, the performance of trades initiated at 80 DTE will be explored.  You can find the prior RUT straddle summary posts at the links below:


The results for these backtests are summarized in six heat map tables.  In these tables, each row corresponds to a different loss exit percentage.  For example, the first row (25) corresponds to the strategy variations where losses were taken at 25% of the credit received.  These rows have values from 25 to 200.  The columns are a little more complicated, and are grouped first by IV rank (IVR) level, and then by profit exit percentage.  You can see that each IVR percentage level contains five columns (10, 25, 35, 45, and NA)...with each column representing a profit taking percentage.  For example, the first column lists all of the strategy variations where the IVR was less than 25% and profits were taken at 10% of the credit received.

The first table shows the average normalized P&L per day by IVR, profit taking percentage, and loss taking percentage. We see the familiar pattern of the IVR > 50% level outperforming the other IVR levels in terms of P&L per day.  The highest daily returns were concentrated in the 45% profit taking level with IVR > 50%.  These were the highest P&L per day readings that we have seen in the RUT straddle backtests, with many readings above 1%.

73 DTE RUT Short Straddle Summary Normalized Percent P&L Per Day
(click to enlarge)

The second table shows the average P&L per trade by IVR, profit taking percentage, and loss taking percentage.  The IVR > 50% level again had the highest P&L per trade readings, with the 45% profit taking level having the greatest strength.  This 45% profit taking level had many readings of 64% returns (based on initial PM requirement).  These were the highest P&L per trade readings that we have seen in the RUT straddle backtests.

73 DTE RUT Short Straddle Summary Normalized Percent P&L Per Trade
(click to enlarge)

The third table shows the win percent / win rate by IVR, profit taking percentage, and loss taking percentage.  The lower the profit taking percentage, the higher the win rate for a given IVR grouping.  The highest win rates occur with profit taking at 10%.  This 10% level had a number of win rates at 100% for the IVR > 50% level.  There were also a number of win rates of 94%, 95%, and 96%.

73 DTE RUT Short Straddle Summary Win Rate
(click to enlarge)

In the fourth table, we see Sortino Ratios by IVR, profit taking percentage, and loss taking percentage.  There were a few cells in the table that displayed as "######" (undefined) because of the 100% win rates associated with these strategy variations.  There were some very large Sortino readings in the IVR > 50% group...some of the biggest we've seen for straddles, with many greater than 1.  The largest Sortinos were concentrated in the IVR > 50% group, with profit taking at 45% and loss taking between 75% and 200%.

73 DTE RUT Short Straddle Summary Sortino Ratio
(click to enlarge)

The fifth table shows profit factor by IVR, profit taking percentage, and loss taking percentage. The region of greatest strength was the IVR > 50% group.  The largest value was 35.8 and occurred in the IVR > 50% group, with profit taking at 45% and loss taking between 75% and 200%.

73 DTE RUT Short Straddle Summary Profit Factor
(click to enlarge)

The last table shows the average days-in-trade (DIT) by IVR, profit taking percentage, and loss taking percentage.  Quicker profit taking, translates into shorter time in the trade.

73 DTE RUT Short Straddle Summary Days In Trade
(click to enlarge)

Which variation of the 73 DTE RUT straddle is best?  If I was going to sell a 73 DTE ATM RUT straddle every month, I would go with the non-IVR filtered variation, taking profits at 25%, with a loss threshold of 50%.  This would put the lower bounds of my gains at 50% of my losses (25/50).  The win rate should be approximately 86%, profit factor at 3.9, and an average P&L per trade of 25%.

Based on all of my SPX and RUT straddle backteests, an IVR of greater than 50% occurs during only about 20% of all possible monthly trade entries.  When this occurs at a 73 DTE trade entry, I would increase my trade size,  take profits closer to 35%, and move my loss taking level to 75%.  This would also cause my trade duration to move from about 41 DIT to 50 DIT.

You can find links to all of my RUT straddle articles, and RUT straddle tweets on the RUT Straddle Summary Page.  In the next post, we will look at the automated backtest results for the short straddle on the RUT at 80 DTE.


Follow my blog by email, RSS feed or Twitter (@DTRTrading).  All options are available on the top of the right hand navigation column under the headings "Subscribe To RSS Feed", "Follow By Email", and "Twitter". 

Wednesday, December 23, 2015

RUT Straddle - 66 DTE - Results Summary

This is the fifth article in a series looking at the backtest results of selling at-the-money (ATM) options straddles on the Russell 2000 index (RUT).  For background on the setup for the backtests, as well as the nomenclature used in the tables below, please see the introductory article for this series: Option Straddle Series - P&L Exits

This post reviews the backtest results for 4160 options straddles sold on the RUT at 66 days-to-expiration (DTE).  Eight different loss approaches were tested on these straddles.  On top of these eight loss approaches, tests were conducted with no profit taking, and profit taking at 10%, 25%, 35%, and 45% of the credit received.  In future articles, the performance of trades initiated at 73 DTE and 80 DTE will be explored.  You can find the prior RUT straddle summary posts at the links below:


The results for these backtests are summarized in six heat map tables.  In these tables, each row corresponds to a different loss exit percentage.  For example, the first row (25) corresponds to the strategy variations where losses were taken at 25% of the credit received.  These rows have values from 25 to 200.  The columns are a little more complicated, and are grouped first by IV rank (IVR) level, and then by profit exit percentage.  You can see that each IVR percentage level contains five columns (10, 25, 35, 45, and NA)...with each column representing a profit taking percentage.  For example, the first column lists all of the strategy variations where the IVR was less than 25% and profits were taken at 10% of the credit received.

The first table shows the average normalized P&L per day by IVR, profit taking percentage, and loss taking percentage. We see the familiar pattern of the IVR > 50% level outperforming the other IVR levels in terms of P&L per day.  The highest daily returns were concentrated in the 45% profit taking level with IVR > 50%, and also the 50% and 75% loss taking levels with IVR > 50%.  The top strategies were the (50:25) and the (50:45) using the IVR > 50% filter.

66 DTE RUT Short Straddle Summary Normalized Percent P&L Per Day
(click to enlarge)

The second table shows the average P&L per trade by IVR, profit taking percentage, and loss taking percentage.  The IVR > 50% level had the highest P&L per trade readings, with the 45% profit taking level and NA level having the greatest strength.  The top strategy was the (50:45) variation using the IVR > 50% filter.

66 DTE RUT Short Straddle Summary Normalized Percent P&L Per Trade
(click to enlarge)

The third table shows the win percent / win rate by IVR, profit taking percentage, and loss taking percentage.  The lower the profit taking percentage, the higher the win rate for a given IVR grouping.  The highest win rates occur with profit taking at 10%.  This 10% level had the highest win rates using the IVR > 25% and IVR > 50% levels.

66 DTE RUT Short Straddle Summary Win Rate
(click to enlarge)

In the fourth table, we see the Sortino Ratio by IVR, profit taking percentage, and loss taking percentage.  The Sortinos at 66 DTE follow a similar pattern to the Sortinos at 59 DTE...there is strength across IVR groups at the 25%, 50%, and 75% loss taking levels.  The region of greatest strength is the non-IVR filtered group...this group contained the largest Sortino Ratios that we've seen across all of the RUT straddle backtests up to this point.  The largest value was 1.05 for the non-IVR filtered (50:45) variation.

66 DTE RUT Short Straddle Summary Sortino Ratio
(click to enlarge)

The fifth table shows the profit factor by IVR, profit taking percentage, and loss taking percentage. There is again strength across IVR groups within the loss taking levels of 25%, 50%, and 75%.  The region of greatest strength was the IVR > 50% group.  The largest value was 5.5 with the (50:45) variation in the IVR > 50% group.

66 DTE RUT Short Straddle Summary Profit Factor
(click to enlarge)

The last table shows the average days-in-trade (DIT) by IVR, profit taking percentage, and loss taking percentage.  Quicker profit taking, translates into shorter time in the trade.

66 DTE RUT Short Straddle Summary Days In Trade
(click to enlarge)

Which variation of the 66 DTE RUT straddle is best?  The (50:45) variation stands out in all of the metrics above.  Personally, this profit taking level is too aggressive for my style of trading.  Although I do appreciate the risk:reward ratio for this variation...which is close to risk one to make one, with a 74% win rate for the non-IVR filtered variation.

If I was going to sell a 66 DTE ATM RUT straddle every month, I would likely go with the non-IVR filtered variation ... taking profits between 25% and 35%, with a loss threshold of 75%.  This would put the lower bounds of my gains at 33% of my losses (25/75).  The win rate would be between 81% and 87%, profit factor between 3.0 and 3.4, and a P&L per trade between 20% and 27%.

Based on all of my SPX and RUT straddle backteests, an IVR of greater than 50% occurs during only about 20% of all possible monthly trade entries.  When this occurs at a 66 DTE trade entry, I would increase my trade size and take profits closer to 25% than 35%, and move by loss taking level to 50%.

You can find links to all of my RUT straddle articles, and RUT straddle tweets on the RUT Straddle Summary Page.  In the next post, we will look at the automated backtest results for the short straddle on the RUT at 73 DTE.


Follow my blog by email, RSS feed or Twitter (@DTRTrading).  All options are available on the top of the right hand navigation column under the headings "Subscribe To RSS Feed", "Follow By Email", and "Twitter". 

Wednesday, December 16, 2015

RUT Straddle - 59 DTE - Results Summary

This is the fourth article in a series looking at the backtest results of selling at-the-money (ATM) options straddles on the Russell 2000 index (RUT).  For background on the setup for the backtests, as well as the nomenclature used in the tables below, please see the introductory article for this series: Option Straddle Series - P&L Exits

This post reviews the backtest results for 4120 options straddles sold on the RUT at 59 days-to-expiration (DTE).  Eight different loss approaches were tested on these straddles.  On top of these eight loss approaches, tests were conducted with no profit taking, and profit taking at 10%, 25%, 35%, and 45% of the credit received.  In future articles, the performance of trades initiated at other DTE (66, 73, and 80) will be explored.  You can find the prior RUT straddle summary posts at the links below:


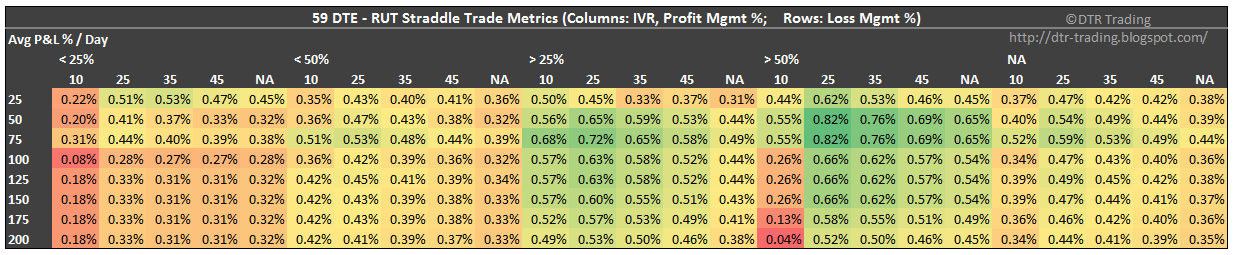
The results in this post are summarized in six heat map tables.  In these tables, each row corresponds to a different loss exit percentage.  For example, the first row (25) corresponds to the strategy variations where losses were taken at 25% of the credit received.  These rows have values from 25 to 200.  The columns are a little more complicated, and are grouped first by IV rank (IVR) level, and then by profit exit percentage.  You can see that each IVR percentage level contains five columns (10, 25, 35, 45, and NA)...with each column representing a profit taking percentage.  For example, the first column lists all of the strategy variations where the IVR was less than 25% and profits were taken at 10% of the credit received.

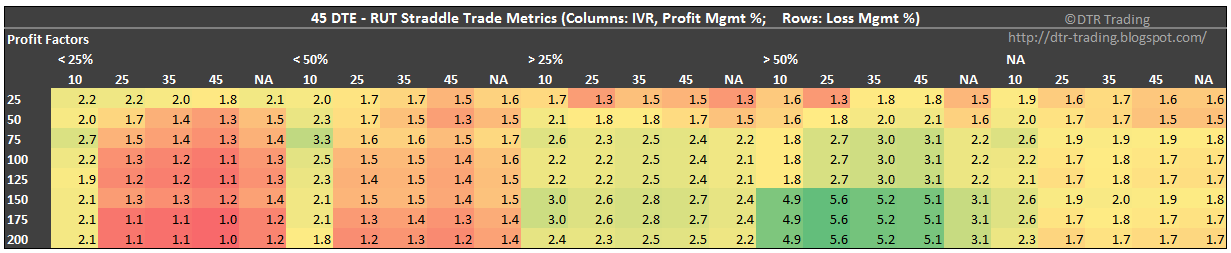
The first table shows the average normalized P&L per day by IVR, profit taking percentage, and loss taking percentage. These 59 DTE tests were typical of past tests, in that the IVR > 50% group outperformed the other IVR groups in terms of P&L per day.  This out-performance was strongest at the loss taking levels of 50% and 75%, and this pattern spanned several IVR groupings.  The highest daily returns were concentrated in the IVR > 50% group, with profit taking at 25% and loss taking at 50% and 75%.

59 DTE RUT Short Straddle Summary Normalized Percent P&L Per Day
(click to enlarge)

The second table shows the average P&L per trade by IVR, profit taking percentage, and loss taking percentage.  The relative under-performance of the 10% profit taking level is striking in this table.  We typically see this profit taking level under-perform in P&L per trade readings, but not by such a large amount.  The IVR > 50% level showed the highest P&L per trade readings.  The highest readings were at loss taking levels of 50% and 75% and carried to expiration...no profit taking threshold.  The loss taking levels of 50% and 75% showed strength across IVR groups.

59 DTE RUT Short Straddle Summary Normalized Percent P&L Per Trade
(click to enlarge)

The third table shows the win percent / win rate by IVR, profit taking percentage, and loss taking percentage.  The highest win rates occur at lower profit taking levels...the lower the profit taking percentage, the higher the win rate for a given IVR grouping.  The highest win rates occur with profit taking at 10%, which is a consistent pattern across both the RUT and SPX straddle tests.  The highest win rates in the table below, are some of the highest we've seen across the RUT straddle tests.

59 DTE RUT Short Straddle Summary Win Rate
(click to enlarge)

In the fourth table, we see the Sortino Ratio by IVR, profit taking percentage, and loss taking percentage.  There are two patterns in this table that are interesting.  The first, is that the the highest Sortino Ratios are concentrated in the low loss taking levels of 25%, 50%, and 75%.  In this band, the greatest region of strength appears in the non-IVR filtered group (NA).

59 DTE RUT Short Straddle Summary Sortino Ratio
(click to enlarge)

The fifth table shows the profit factor by IVR, profit taking percentage, and loss taking percentage.  There is again an region of strength with loss taking levels of 25%, 50%, and 75%.

59 DTE RUT Short Straddle Summary Profit Factor
(click to enlarge)

The last table shows the average days-in-trade (DIT) by IVR, profit taking percentage, and loss taking percentage.  Quicker profit taking, translates into shorter time in the trade.  In general, the higher the DTE and trade initiation, the longer it will take to reach the desired profit taking level.

59 DTE RUT Short Straddle Summary Days In Trade
(click to enlarge)

Which variation of the 59 DTE straddle is best? If I was going to sell a 59 DTE ATM RUT straddle every month, I would likely go with the non-IVR filtered variation ... taking profits at 25%, with a loss threshold of 75%.  This would put my gains at 1/3 my losses (25/75), and a win rate at approximately 86%.  For the (75:25) variation, the average P&L per day is 0.59% and the average P&L per trade is 20%, measured in terms of margin required.  When the IVR goes above 50% (at trade entry for new trades), I would increase position size and keep the profit and loss exits the same.

You can find links to all of my RUT straddle articles, and RUT straddle tweets on the RUT Straddle Summary Page.  In the next post, we will look at the automated backtest results for the short straddle on the RUT at 66 DTE.


Follow my blog by email, RSS feed or Twitter (@DTRTrading).  All options are available on the top of the right hand navigation column under the headings "Subscribe To RSS Feed", "Follow By Email", and "Twitter". 

Wednesday, December 9, 2015

RUT Straddle - 52 DTE - Results Summary

This is the third article in a series looking at the backtest results of selling at-the-money (ATM) options straddles on the Russell 2000 index (RUT).  For background on the setup for the backtests, as well as the nomenclature used in the tables below, please see the introductory article for this series: Option Straddle Series - P&L Exits

This post reviews the backtest results for 4120 options straddles sold on the RUT at 52 days-to-expiration (DTE).  Eight different loss approaches were tested on these straddles.  On top of these eight loss approaches, tests were conducted with no profit taking, and profit taking at 10%, 25%, 35%, and 45% of the credit received.  In future articles, the performance of trades initiated at other DTE (59, 66, 73, and 80) will be explored.  You can find the prior RUT straddle summary posts at the links below:


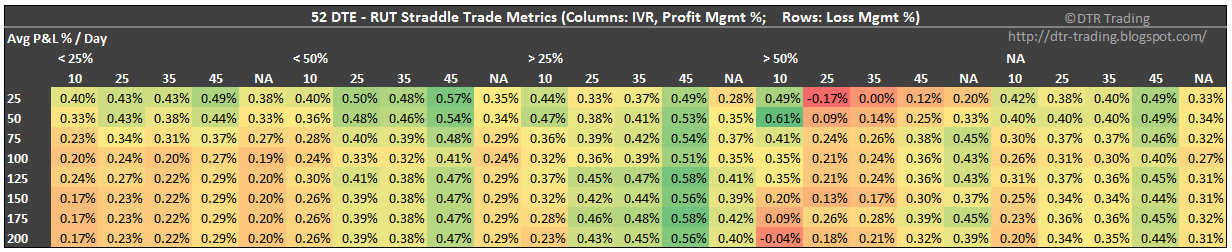
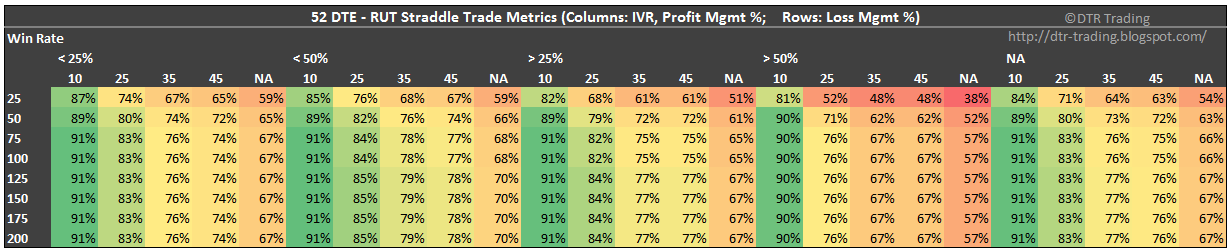
The results in this post are summarized in six heat map tables.  In these tables, each row corresponds to a different loss exit percentage.  For example, the first row (25) corresponds to the strategy variations where losses were taken at 25% of the credit received.  These rows have values from 25 to 200.  The columns are a little more complicated, and are grouped first by IV rank (IVR) level, and then by profit exit percentage.  You can see that each IVR percentage level contains five columns (10, 25, 35, 45, and NA)...with each column representing a profit taking percentage.  For example, the first column lists all of the strategy variations where the IVR was less than 25% and profits were taken at 10% of the credit received.

The first table shows the average normalized P&L per day by IVR, profit taking percentage, and loss taking percentage. This set of 52 DTE tests was unusual, in that the IVR > 50% level did not outperform the other IVR levels.  The highest daily returns were concentrated in the 45% profit taking levels with IVR < 50%, IVR > 25%, and NA (non-IVR filtered).  There were two strong IVR > 50% variations...(25:10) and (50:10).

52 DTE RUT Short Straddle Summary Normalized Percent P&L Per Day
(click to enlarge)

The second table shows the average P&L per trade by IVR, profit taking percentage, and loss taking percentage.  The 45% profit taking levels stood out again.  In addition, there was an area of strength with an IVR > 50% and profit taking at NA...trades carried to expiration.

52 DTE RUT Short Straddle Summary Normalized Percent P&L Per Trade
(click to enlarge)

The third table shows the win percent / win rate by IVR, profit taking percentage, and loss taking percentage.  The highest win rates occur at lower profit taking levels...the lower the profit taking percentage, the higher the win rate for a given IVR grouping.  The highest win rates occur with profit taking at 10%....with this profit taking level, the win percentages were nearly identical across IVR filter levels.

52 DTE RUT Short Straddle Summary Win Rate
(click to enlarge)

In the fourth table, we see the Sortino Ratio by IVR, profit taking percentage, and loss taking percentage.  I think it's interesting how the trades initiated at high IVR levels under-performed in terms of Sortino.  The IVR > 50% level had the lowest Sortino numbers followed by the IVR > 25% level

52 DTE RUT Short Straddle Summary Sortino Ratio
(click to enlarge)

The fifth table shows the profit factor by IVR, profit taking percentage, and loss taking percentage.  The variations with the lowest Sortino Ratio numbers were also the variations with the lowest profit factor readings.  We've seen this trend in past tests as well...the areas with strong Sortinos are typically the areas with strong profit factors...and vice versa.

52 DTE RUT Short Straddle Summary Profit Factor
(click to enlarge)

The last table shows the average days-in-trade (DIT) by IVR, profit taking percentage, and loss taking percentage.  Quicker profit taking, translates into shorter time in the trade.

52 DTE RUT Short Straddle Summary Days In Trade
(click to enlarge)

Which variation of the 52 DTE RUT straddle is best?  Truthfully, I'm not a big fan of any of these variations based on the test results in this post.  Also, the patterns that we noticed in the past straddle tests on the RUT and SPX did not repeat in these results.  This was unusual.

If I had to sell a 52 DTE ATM RUT straddle every month, I would likely go with the non-IVR filtered variation ... taking profits at 25%, with a loss threshold of 75%.  This would put my gains at 33% of my losses (25/75), and a win rate at approximately 83%.

You can find links to all of my RUT straddle articles, and RUT straddle tweets on the RUT Straddle Summary Page.  In the next post, we will look at the automated backtest results for the short straddle on the RUT at 59 DTE.


Follow my blog by email, RSS feed or Twitter (@DTRTrading).  All options are available on the top of the right hand navigation column under the headings "Subscribe To RSS Feed", "Follow By Email", and "Twitter". 

Wednesday, December 2, 2015

RUT Straddle - 45 DTE - Results Summary

This is the second article in a series looking at the backtest results of selling at-the-money (ATM) options straddles on the Russell 2000 index (RUT).  For background on the setup for the backtests, as well as the nomenclature used in the tables below, please see the introductory article for this series: Option Straddle Series - P&L Exits

This post reviews the backtest results for 4080 options straddles sold on the RUT at 45 days-to-expiration (DTE).  Eight different loss approaches were tested on these straddles.  On top of these eight loss approaches, tests were conducted with no profit taking, and profit taking at 10%, 25%, 35%, and 45% of the credit received.  In future articles, the performance of trades initiated at other DTE (52, 59, 66, 73, and 80) will be explored.  You can find the 38 DTE post here.

The results in this post are summarized in six heat map tables.  In these tables, each row corresponds to a different loss exit percentage.  For example, the first row (25) corresponds to the strategy variations where losses were taken at 25% of the credit received.  These rows have values from 25 to 200.  The columns are a little more complicated, and are grouped first by IV rank (IVR) level, and then by profit exit percentage.  You can see that each IVR percentage level contains five columns (10, 25, 35, 45, and NA)...with each column representing a profit taking percentage.  For example, the first column lists all of the strategy variations where the IVR was less than 25% and profits were taken at 10% of the credit received.

The first table shows the average normalized P&L per day by IVR, profit taking percentage, and loss taking percentage. The highest daily returns are concentrated in the IVR > 50% columns, specifically the column associated with profit taking at 35%.  I will try to Tweet these specific equity curves sometime in the next few days.

45 DTE RUT Short Straddle Summary Normalized Percent P&L Per Day
(click to enlarge)

The second table shows the average P&L per trade by IVR, profit taking percentage, and loss taking percentage.  The area with the highest P&L per trade values was IVR > 50% and profit taking at 35%, 45%, and NA.  Most of the P&L per trade numbers are higher for the 45 DTE variations compared to the 38 DTE variations...as you'd expect.

45 DTE RUT Short Straddle Summary Normalized Percent P&L Per Trade
(click to enlarge)

The third table shows the win percent / win rate by IVR, profit taking percentage, and loss taking percentage.  The highest win rates occur at lower profit taking levels...the lower the profit taking percentage, the higher the win rate for a given IVR grouping.  The highest win rates occur with an IVR < 25%, and profit taking at 10%....all of these variations have 93% win rates except for the (25:10) and (50:10) variations.  This is a familiar pattern across DTE and products.

45 DTE RUT Short Straddle Summary Win Rate
(click to enlarge)

In the fourth table, we see the Sortino Ratio by IVR, profit taking percentage, and loss taking percentage.  The highest Sortino Ratios were associated with the same IVR > 50% group, profit taking at 25%, 35%, 45% and loss taking at 150%, 175%, and 200%.

45 DTE RUT Short Straddle Summary Sortino Ratio
(click to enlarge)

The fifth table shows the profit factor by IVR, profit taking percentage, and loss taking percentage.  The largest profit factor values occurred at IVRs > 50%, profit taking at 10%, 25%, 35%, and 45%, and loss taking at 150%, 175%, and 200%.  The variations with the highest profit factors were also the variations with the highest Sortino Ratios.

45 DTE RUT Short Straddle Summary Profit Factor
(click to enlarge)

The last table shows the average days-in-trade (DIT) by IVR, profit taking percentage, and loss taking percentage.  Quicker profit taking, translates into shorter time in the trade.

45 DTE RUT Short Straddle Summary Days In Trade
(click to enlarge)

Which variation of the 45 DTE straddle is best?  None of the variations really jump out at me as good options.  If I was going to sell a 45 DTE ATM RUT straddle every month, I would likely go with the non-IVR filtered variation ... taking profits at 35%, with a loss threshold of 75%.  This would put my gains at 50% of my losses (35/75), and a win rate at approximately 74%.  When the IVR goes above 50% (at trade entry for new trades), I would increase position size and keep the profit and loss exits the same (or become more conservative with both).

In the next post, we will look at the automated backtest results for the short straddle on the RUT at 52 DTE.


Follow my blog by email, RSS feed or Twitter (@DTRTrading).  All options are free, and are available on the top of the right hand navigation column under the headings "Subscribe To RSS Feed", "Follow By Email", and "Twitter".  I follow blogs by RSS using Feedly, but any RSS reader will work.