Tuesday, January 17, 2017

45 DTE Iron Condor Results Summary

This article looks at iron condors (IC) entered at 45 days to expiration (DTE). The introduction to this series, here, describes the different variations of SPX iron condors (IC) and exits that were tested.

As mentioned in the 38 DTE IC results summary post, these tests covered 9 IC variations, with short strike deltas at four locations, utilizing 12 exits.  In all, there were 432 test runs (9 variations x 4 deltas x 12 exits). Each test run executed more than 200 SPX IC trades between the Jan-2007 expiration and the Sep-2016 expiration.  I used weekly options for this testing, so there were more than 12 trades per year.  In total, there were 96,624 total trades entered for the 45 DTE testing.

For an explanation of the nomenclature used in this article as well as the chart structure and composition, please read the first IC results post here.


Normalized P&L per Day

This first set of charts shows normalized P&L per day percentages.  The P&L per day values are expressed as a percentage of the max risk for that test run...this is necessary in order to fairly compare the returns of each of the different wing widths (25 point, 50 point, 75 point).

The results:
  1. Similar to the 38 DTE ICs, there is more variability in P&L per day readings in the 25 point wing width ICs
  2. Again, similar to the 38 DTE ICs, as the delta of the short strikes increases, the variability in the P&L per day readings increases
  3. The largest reading was 0.18% and was associated with the three strategy variations:
    1. DN (300:50), 25 point wings, 20 delta
    2. DN (NA:50), 25 point wings, 20 delta
    3. ST (200:50), 25 point wings, 20 delta
  4. The next best reading was 0.17% and was associated with two test runs: 
    1. ST (200:50), 50 point wings, 20 delta
    2. ST (200:50), 75 point wings, 20 delta
  5. The top 22 readings were all associated with a profit level of 50%
    1. Of these 22 readings, 18 were associated with a short delta of 20
(click to enlarge)


Normalized P&L per Trade

The normalized P&L per trade charts display returns expressed as a percentage of the max risk for a particular test run.

We see the following in the data:
  1. The variability in normalized P&L per trade again increases as the delta of the short strike increases, and decreases with increasing wing width
  2. The largest normalized P&L per trade was 5.2% for the DN (NA:50), 25 point wings, 20 delta
  3. The top 7 P&L per trade variations were all associated short strike deltas of 20
  4. The top 4 P&L per trade variations were all associated with profit taking at 50%
  5. The top 3 trades in terms of P&L per day were also in the top three in terms of P&L per trade, but in a different order
  6. The 45 DTE ICs have slightly larger P&L per trade readings than the 38 DTE ICs ( avg 2.23% / sd 0.87% VS avg 1.88% / SD 0.75%)
(click to enlarge)


Win Rate

The chart structure should be familiar to you by now, so I'll not review the chart layouts.  The win rate trends are clear:
  1. In general, win rates tend to increase as wing widths increase
  2. Win rates tend to increase as the delta of the short strike decreases
  3. The top win rate was 95%, and was associated with these strategies:
    1. DN (NA:50), wing width 75, 8 delta
    2. DN (NA:50), wing width 25, 8 delta
  4. The top 26 strategies all had win rates of 91% or better. 
    1. Of these 26, 19 took profits at 50%
    2. Of these 26, 21 did not use loss exits (they exited at 2 DTE)
    3. Of these 26, 20 had short strike deltas of 8
  5. The strategies with the top win rates also had some of the largest single losses...as you'd expect for strategies not using loss exits
  6. The win rates for the 45 DTE ICs were similar to the win rates for the 38 DTE ICs
(click to enlarge)


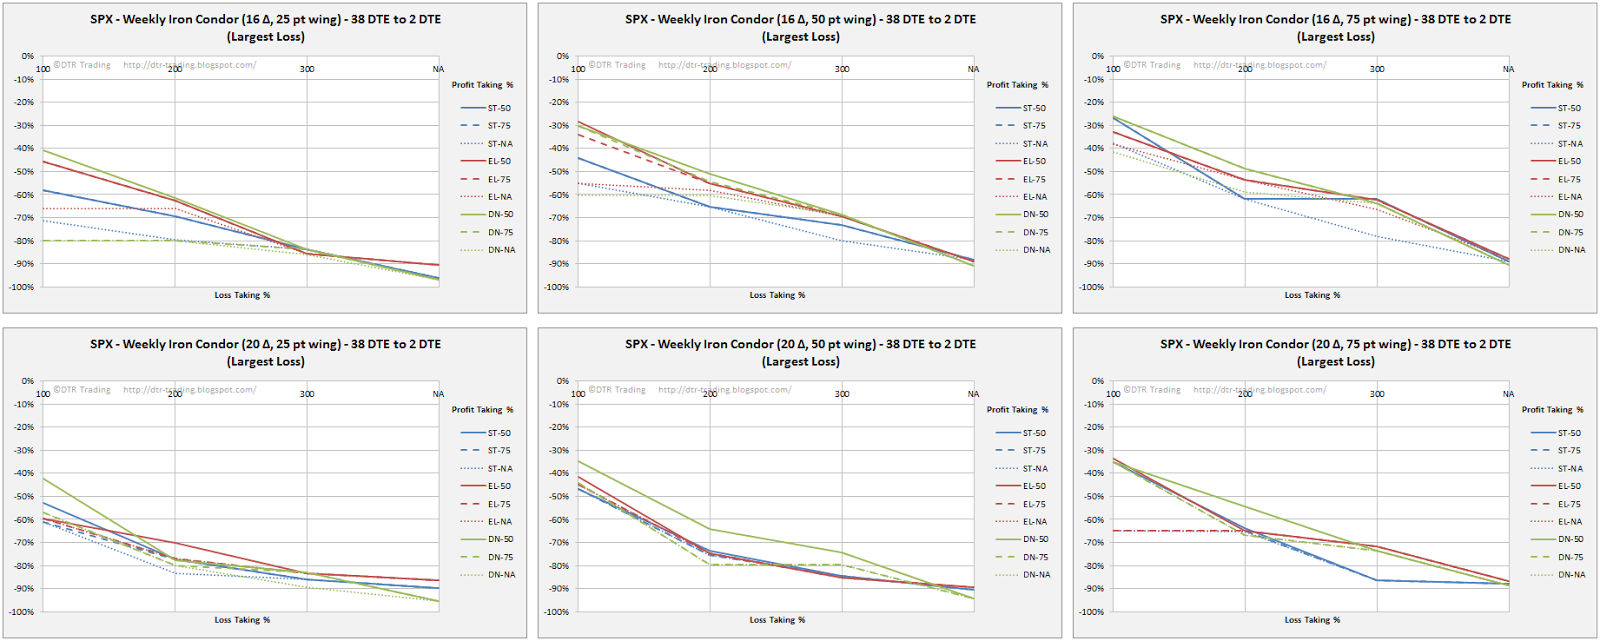
Largest Loss

The next charts show the normalized largest loss for each of the test runs  These largest losses are expressed as a percentage of the max defined risk number for all of the 200+ trades in a test run.

The results:
  1. The largest loss percentage increases with increasing short strike delta
  2. The largest loss percentage increases with increasing loss taking level
  3. 39 strategy variations had largest loss readings of 95% or greater
    1. All 39 carried trades to 2 DTE and did not use loss taking levels
    2. All wing widths, short strike deltas, and structures (ST, DN, EL) were present in these 39 strategy variations
  4. The top 9 smallest losses all occurred with strategies with 75 point wing widths and 8 delta short strikes.  The top three were:
    1. DN (100:50), 75 point wings, 8 delta -> 15% loss
    2. DN (100:75), 75 point wings, 8 delta -> 15% loss
    3. DN (100:NA), 75 point wings, 8 delta ->17% loss
(click to enlarge)


Profit Factor

The best 14 profit factors were associated with delta neutral (DN) trades.  The top 10 of these 14 had 8 delta short strikes.  The top 9 of these 14 had profit factors of 2.0 or greater.

The results:
  1. The top performers were:
    1. DN (NA:50), 25 point wings, 8 delta -> 2.4 (win rate 95%)
    2. DN (NA:50), 75 point wings, 8 delta -> 2.2 (win rate 95%)
    3. DN (NA:75), 75 point wings, 8 delta -> 2.1 (win rate 93%)
    4. DN (NA:NA), 75 point wings, 8 delta -> 2.1 (win rate 89%)
  2. These top performers also had some of the largest single losses due to not implementing loss taking exits
(click to enlarge)


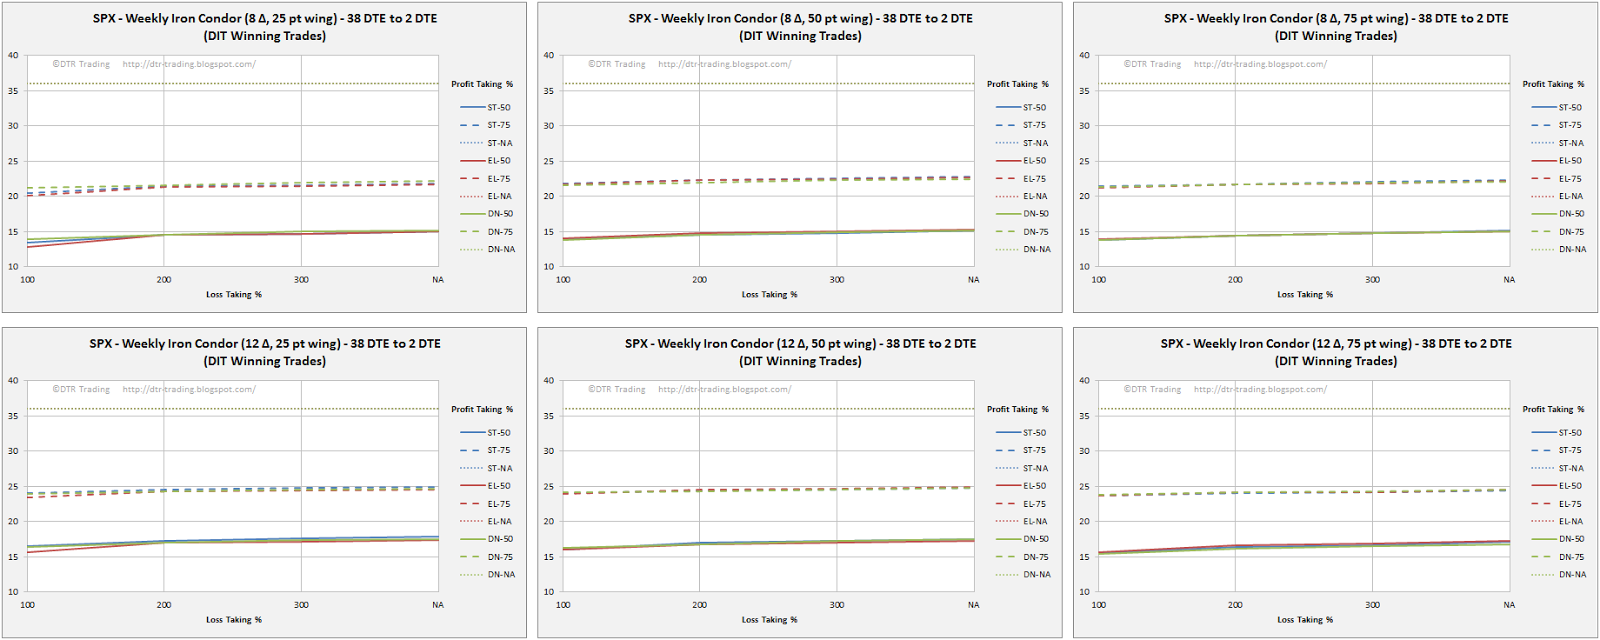
Average DIT For Winning Trades

This metric was derived by averaging all of the DIT for all of the winning trades in a test run. Adding a DIT exit to your profit and loss exits is worth considering.

Here are a few trends:
  1. The larger the delta of your short strikes the longer you'll need to stay in your trades
  2. The larger your profit taking level, the longer you'll need to stay in your trade
  3. The 50% profit taking level should have you out of your trade between 16 and 26 days for a 45 DTE IC
  4. The smallest winning trade DITs of 16 were associated with 8 delta short strikes, profit taking at 50%, and loss taking at 100%...the structure type (ST, EL, DN) did not matter as seen in the charts
(click to enlarge)

Part 2 will be published some time next week and will compare the weekly trades with the monthly trades.


Follow my blog by email, RSS feed or Twitter (@DTRTrading).  All options are available on the top of the right hand navigation column under the headings "Subscribe To RSS Feed", "Follow By Email", and "Twitter". 

Tuesday, January 3, 2017

38 DTE Iron Condor Results Summary - Part 2

In the last post, 38 DTE Iron Condor Results Summary, I showed the backtest results from 97,416 iron condor (IC) trades.  All of those test results were based on weekly expiration data at 38 days to expiration (DTE).  In this post, we'll look at a few key metrics and how those metrics differ between weekly data and monthly data.

The charts below are organized similar to those in the prior post. Each group of charts corresponds to the short delta listed in the heading bullet (8 delta, 12 delta, 16 delta, 20 delta).  Each column corresponds to an IC wing width (column 1 = 25 points, column 2 = 50 points, column 3 = 75 points).

The first row in each group displays the backtest results associated with weekly data, and the second row in each group displays the backtest results associated with monthly expiration data.  Weekly data could result in a new trade being initiated every week (if the entry criteria were satisfied), while the monthly expiration data would result in at most one trade per month (if the entry criteria were satisfied).  The monthly data does represent a subset of the weekly data, but will more closely match actual trade results for traders who initiate on monthly expirations rather than weekly expirations.

Lastly, trades can overlap...which means there can be multiple trades active at any point in the backtesting.  Opening a new trade does not require the prior trade to be closed.

In this post, we'll only review three metrics:
  1. Normalized P&L per day
  2. Normalized P&L per trade
  3. Win rate

Normalized P&L per Day

  • 8 delta short strikes (weekly data top, monthly data bottom)
    • At 8 delta, the delta neutral structure outperforms the other IC structures.
(click to enlarge)

  • 12 delta short strikes (weekly data top, monthly data bottom)
    • At 12 delta, the 75% profit taking level results in more stable returns as wing width increases.  The P&L lines are also more tightly grouped by profit taking level (50, 75, NA) as wing width increases, indicating that profit taking level has a larger impact on P&L than IC structure at this delta.
(click to enlarge)

  • 16 delta short strikes (weekly data top, monthly data bottom)
    • As wing width increases, the P&L per day lines become closer to each other and appear to converge.  The 75% profit taking level outperforms the other levels, except for the delta neutral structure.  For the delta neutral IC structure, the 50% profit taking level outperforms with 25 point and 50 point wings.
(click to enlarge)

  • 20 delta short strikes (weekly data top, monthly data bottom)
    • At 20 delta, the returns associated with the 50% profit taking level generally outperform the other profit taking levels.
(click to enlarge)

The difference between the weekly and monthly results is not large.  In general the grouping of the P&L lines in the weekly results is "tighter" than with the monthly results.


Normalized P&L per Trade

  • 8 delta short strikes (weekly data top, monthly data bottom)
    • In the monthly data, we see that taking the trades to expiration resulted in larger P&L per trade results than either the 50% or 75% profit taking levels.  The weekly data, in general, shows the 75% profit taking level narrowly beating taking the trade to expiration.
(click to enlarge)

  • 12 delta short strikes (weekly data top, monthly data bottom)
    • Again, in the monthly data we see that taking the trades to expiration results in greater profits per trade than exiting at the 75% profit taking level.  In the weekly data, the 75% profit taking level beats taking the trades to expiration.
(click to enlarge)

  • 16 delta short strikes (weekly data top, monthly data bottom)
    • As the wing widths increase, we see convergence of the P&L lines by profit taking level.  The IC structure appears to have less of an impact on returns than the profit taking level...as wing width increases.
(click to enlarge)

  • 20 delta short strikes (weekly data top, monthly data bottom)
    • At 20 delta, the 50% profit taking level outperforms at wing widths of 25 points and 50 points.  As we increase the wing width to 75 points, the 75% profit taking level begins to outperform with increasing loss taking levels.
(click to enlarge)

The weekly results are again more tightly grouped than the monthly results.  The weekly data can result in approximately four times as many trades as the monthly data.  This increase in the number of trades in the weekly data reduces the impact of those trades with "extreme" results (both positive and negative).


Win Rate

  • 8 delta short strikes (weekly data top, monthly data bottom)
    • The 50% profit taking level outperforms the other profit taking levels at 8 delta.  The win rate lines appear to be grouped more by profit taking level than by IC structure type.
(click to enlarge)

  • 12 delta short strikes (weekly data top, monthly data bottom)
    • At 12 delta, the 50% profit taking level again outperforms the other profit taking levels.  At this delta and 50% profit taking level, the delta neutral structure outperforms the other IC structure types.
(click to enlarge)

  • 16 delta short strikes (weekly data top, monthly data bottom)
    • At 16 delta, win rate grouping by profit taking level is even more pronounced.
(click to enlarge)

  • 20 delta short strikes (weekly data top, monthly data bottom)
    • At 20 delta, the win rate grouping by profit taking level is even stronger.  The 50% profit taking level is the clear win rate winner.
(click to enlarge)

In general, the win rate lines have a steeper slope from the 100% loss taking level to the 200% loss taking level.  The slope tapers off after the 200% loss taking level.  When we review the P&L per trade numbers at the 100% loss taking level and 200% loss taking level, in general these P&L per trade numbers decrease as we move from the 100% loss taking level to the 200% loss taking level.  Even though the win rate is lower at the 100% loss taking level, the total losses are lower at this level, resulting in a greater P&L per trade value at the 100% loss taking level.

There are several "take-aways" from the results shown in these two articles:
  1. As short strike deltas are increased, take profits at lower profit taking levels.  For example, at 8 delta, take profits at 75%, while at 20 delta, take profits at 50%.
  2. The extra long put structure generally under performs the delta neutral and standard balanced structures.
  3. At lower short strike deltas, there is value in using the delta neutral structure.  As short strike delta increases, the value in the delta neutral structure decreases.
  4. At the 50% profit taking level you will generally be out of your trade for a profit between 15 and 20 days.  If you haven't hit your profit target in 20 days, you should close your trade.
  5. The 50% profit taking level has a higher win rate than the other profit taking levels.
  6. The 100% loss taking level generally has a higher P&L per trade than the 200% and larger loss taking levels.
  7. The 100% loss taking level generally has a lower win rate than the larger loss taking levels.

Follow my blog by email, RSS feed or Twitter (@DTRTrading).  All options are available on the top of the right hand navigation column under the headings "Subscribe To RSS Feed", "Follow By Email", and "Twitter". 

Thursday, December 22, 2016

38 DTE Iron Condor Results Summary

The introduction to this series, here, described the different variations of SPX iron condors (IC) and exits that were tested at 38 days to expiration (DTE).  Recall, the tests covered 9 IC variations, with short strike deltas at four locations, utilizing 12 exits.  In all, there were 432 test runs (9 variations x 4 deltas x 12 exits). Each test run executed more than 200 SPX IC trades between the Jan-2007 expiration and the Sep-2016 expiration.  I used weekly options for this testing, so there were more than 12 trades per year.  In total, there were 97,416 total trades entered for the 38 DTE testing.

There are six groupings of charts below, with each grouping containing 12 charts.  Each row corresponds to a short delta (row 1 = 8 delta, row 2 = 12 delta, row 3 = 16 delta, row 4 = 20 delta), and each column corresponds to an IC wing width (column 1 = 25 points, column 2 = 50 points, column 3 = 75 points).

Each of the charts contains data for the 12 exits for each of the three primary IC structures (standard balanced - ST, extra long put - EL, delta neutral - DN).

All of the charts are structured similarly:
  • Each colored line in a chart represents a particular type of IC structure:
    • Blue lines are for standard balanced ICs (ST)
    • Red lines are for extra long put ICs (EL)
    • Green lines are for delta neutral ICs (DN)
  • The lines styles are associated with a particular profit taking approach:
    • Solid lines represent profit taking at 50% of the credit received
    • Dashed lines represent profit taking at 75% of the credit received
    • Dotted lines represent closing the trade at 2 DTE with no profit taking target (NA)
  • The X-axis displays the loss taking percentage level in terms of the credit received:
    • 100%, 200%, 300%, and no loss taking level / closing at 2 DTE (NA)

Normalized P&L per Day

This first set of charts shows normalized P&L Per Day percentages.  A couple of notes on these charts:
  • The Y-axis scale is the same for all the P&L per day charts in this blog post
  • The Y-axis displays the average normalized percent P&L per day
  • Each of the 432 test runs is represented in the 12 charts below, and each test run had a different average days-in-trade (DIT).  The number DIT obviously impacts the average P&L per day
  • The max risk for a 25 point 8 delta IC will be approximately half the max risk for a 50 point 8 delta IC.  The P&L per day values are expressed as a percentage of the max risk for that test run...this is necessary in order to fairly compare the returns of each of the different wing widths
A couple of trends are clear:
  1. There is more variability in P&L per day readings in the 25 point wing width ICs
  2. As the delta of the short strikes increases, the variability in the P&L per day readings increases
  3. The largest reading was 0.18% and was associated with the ST (100:50), 50 point wings, 20 delta
  4. The next best reading was 0.17% and was associated with three test runs: 
    1. ST (100:50), 25 point wings, 20 delta
    2. ST (100:75), 25 point wings, 16 delta
    3. DN(100:50), 25 point wings, 20 delta
(click to enlarge)


Normalized P&L per Trade

The normalized P&L per trade charts are organized in the same way as the normalized P&L per day charts.  Also note that these returns are expressed as a percentage of the max risk for a particular test run.  There were 432 test runs, with each test run including 200+ trades.  In a test run, the $ returns for each of these trades varied slightly, as well as the $ max risk for each of these trades.  The $ returns were averaged, and this $ average was divided by the largest $ max risk for all of the 200+ trades in that run.  This is the normalized P&L for that test run...with all 432 of these data points displayed in the 12 charts below.

We see the following in the data:
  1. We can see that the variability in normalized P&L per trade again increases as the delta of the short strike increases, and decreases with increasing wing width.
  2. The largest normalized P&L per trade was 4.3% for the ST (200:75), 25 point wings, 16 delta
  3. The top four P&L per trade variations were all associated with profit taking at 75%, wing widths of 25 points, and short strike deltas of 16
  4. The top P&L per day variations came in the following positions in terms of P&L per trade:
    1. ST (100:50), 50 point wings, 20 delta came in 7th place -> 3.4%
    2. ST (100:50), 25 point wings, 20 delta came in 11th place -> 3.4%
    3. ST (100:75), 25 point wings, 16 delta came in 2nd place -> 4.1%
    4. DN(100:50), 25 point wings, 20 delta came in 5th place -> 3.5%
(click to enlarge)


Win Rate

The chart structure should be familiar to you by now, so I'll not review the chart layouts.  The win rate trends are clear:
  1. Win rates tend to increase as wing widths increase
  2. Win rates tend to increase as the delta of the short strike decreases
  3. The top win rate was 92%, and was associated with these five strategies:
    1. DN (NA:50), wing width 75, 8 delta
    2. DN (NA:50), wing width 50, 8 delta
    3. ST (NA:50), wing width 50, 8 delta
    4. ST (NA:50), wing width 75, 8 delta
    5. DN (NA:50), wing width 25, 8 delta
  4. The top 10 strategies all had win rates of 91% or better...and all 10 had two variables in common...they took profits at 50%, and none of them used loss exits (they exited at 2 DTE).  8 of these 10 also had short strike deltas of 8.
(click to enlarge)


Largest Loss

The next charts show the normalized largest loss for each of the test runs  These largest losses are expressed as a percentage of the max defined risk number for all of the 200+ trades in a test run.  Here are the trends:
  1. The largest loss percentage increases with increasing short strike delta
  2. The largest loss percentage increases with increasing loss taking level...surprise! :)
  3. The top 24 largest losses all occurred with strategies with 25 point wing widths, and had losses of 95% or greater
  4. The top 4 smallest losses all occurred with strategies with 75 point wing widths and 8 delta short strikes:
    1. DN (100:50), 75 point wings, 8 delta -> 15% loss
    2. DN (100:75), 75 point wings, 8 delta -> 15% loss
    3. ST (100:50), 75 point wings, 8 delta ->15% loss
    4. ST (100:75), 75 point wings, 8 delta -> 15% loss
(click to enlarge)


Profit Factor

The best 15 profit factors were associated with delta neutral trades with 8 delta short strikes.  The top performers were:
  1. DN (NA:NA), 75 point wings, 8 delta -> 2.0
  2. DN (NA:75), 50 point wings, 8 delta -> 1.9
  3. DN (NA:75), 75 point wings, 8 delta -> 1.9
  4. DN (NA:NA), 50 point wings, 8 delta -> 1.9
  5. DN (300:75), 50 point wings, 8 delta -> 1.9 
(click to enlarge)


Average DIT For Winning Trades

This metric was derived by averaging all of the DIT for all of the winning trades in test run.  If you are basing your IC trading on one of the 432 variations in my backtesting, you'll want to keep an eye on these DIT numbers.  Adding a DIT exit to your profit and loss exits is worth considering.

Here are a few trends:
  1. The larger the delta of your short strikes the longer you'll need to stay in your trades
  2. The larger your profit taking level, the longer you'll need to stay in your trade...surprise! :)
  3. The 50% profit taking level should have you out of the trade in less than 20 days for a 38 DTE IC
  4. The smallest winning trade DITs were associated with 8 delta short strikes, profit taking at 50%, and loss taking at 100%...the structure type (ST, EL, DN) did not matter as seen in the charts
(click to enlarge)

A part two to this article will follow some time next week.

Follow my blog by email, RSS feed or Twitter (@DTRTrading).  All options are available on the top of the right hand navigation column under the headings "Subscribe To RSS Feed", "Follow By Email", and "Twitter". 

Tuesday, December 20, 2016

New Iron Condor Series Introduction

If you've been following my Twitter feed, you know that I have started analyzing Iron Condors (IC) again. I am looking at the same three structures that I've looked at in past posts (standard balanced IC, delta neutral IC, and extra long put IC), but with varying wing widths.  Part of the motivation here is to see if we can get close to short strangle returns, but with defined risk. 

In the screen shots below, are examples of these three structures, with the three different wing widths that will be reviewed (25 point, 50 point, and 75 point).   These screen shots were taken after market close on Monday, December 19th, using the SPX 17-Feb-2017 expiration at 59 DTE.  The standard balanced ICs are all 10 contracts / 10 lot.  The delta neutral IC and extra long put IC modify this 10 lot structure as shown below.


Standard Balanced Iron Condor (ST)
  • 25 point wing width 
    • Strikes: 2415 / 2390 / 2045 / 2020
    • Short Delta: 8 
    • Credit: $2,100
    • Max Risk: $22,850
59 DTE SPX standard balanced iron condor with 8 delta short strikes and 25 point wings
(click to enlarge)

  • 50 point wing width 
    • Strikes: 2440 / 2390 / 2045 / 1995
    • Short Delta: 8 
    • Credit: $3,600
    • Max Risk: $46,400
59 DTE SPX standard balanced iron condor with 8 delta short strikes and 50 point wings
(click to enlarge)

  • 75 point wing width
    • Strikes: 2465 / 2390 / 2045 / 1970
    • Short Delta: 8
    • Credit: $4,700
    • Max Risk: $70,300
59 DTE SPX standard balanced iron condor with 8 delta short strikes and 75 point wings
(click to enlarge)


Extra Long Put Iron Condor (EL)
  • 25 point wing width
    • Strikes: 2415 / 2390 / 2045 / 2020
    • Short Delta: 8
    • Credit: $1,565
    • Max Risk: $23,435
59 DTE SPX extra long put iron condor with 8 delta short strikes and 25 point wings
(click to enlarge)

  • 50 point wing width
    • Strikes: 2440 / 2390 / 2045 / 1995
    • Short Delta: 8
    • Credit: $3,145
    • Max Risk: $46,855
59 DTE SPX extra long put iron condor with 8 delta short strikes and 50 point wings
(click to enlarge)

  • 75 point wing width
    • Strikes: 2465 / 2390 / 2045 / 1970
    • Short Delta: 8
    • Credit: $4,340
    • Max Risk: $70,660
59 DTE SPX extra long put iron condor with 8 delta short strikes and 75 point wings
(click to enlarge)


Delta Neutral Iron Condor (DN)
  • 25 point wing width
    • Strikes: 2415 / 2390 / 2045 / 2020
    • Short Delta: 8
    • Credit: $1,525
    • Max Risk: $23,475
59 DTE SPX delta neutral iron condor with 8 delta short strikes and 25 point wings
(click to enlarge)

  • 50 point wing width
    • Strikes: 2440 / 2390 / 2045 / 1995
    • Short Delta: 8
    • Credit: $2,675
    • Max Risk: $47,325
59 DTE SPX delta neutral iron condor with 8 delta short strikes and 50 point wings
(click to enlarge)

  • 75 point wing width
    • Strikes: 2465 / 2390 / 2045 / 1970
    • Short Delta: 8
    • Credit: $3,575
    • Max Risk: $71,425
59 DTE SPX delta neutral iron condor with 8 delta short strikes and 75 point wings
(click to enlarge)

Over the next several months I will review how these 9 IC variations have performed between the Jan-2007 expiration and the Sep-2016 expiration on the SPX.  Unlike past tests, in this series, I will include weekly options.  This will provide more trade occurrences, thus resulting in more meaningful metrics.

I will look at four different short strike deltas (8, 12, 16, and 20), across several DTE (38, 45, 52, 59, 66, 73, and 80) for the 9 IC variations above.

The following 12 exits will be tested for each of the 9 variations at each delta, for each DTE:
  1. NA:NA - exit at 2 DTE.
  2. NA:50 - exit if the trade has a profit of 50% of its initial credit OR 2 DTE.
  3. NA:75 - exit if the trade has a profit of 75% of its initial credit OR 2 DTE.
  4. 100:NA - exit if the trade has a loss of 100% of its initial credit OR 2 DTE.
  5. 100:50 - exit if the trade has a loss of 100% of its initial credit OR if the trade has a profit of 50% of its initial credit OR 2 DTE.
  6. 100:75 - exit if the trade has a loss of 100% of its initial credit OR if the trade has a profit of 75% of its initial credit OR 2 DTE.
  7. 200:NA - exit if the trade has a loss of 200% of its initial credit OR 2 DTE.
  8. 200:50 - exit if the trade has a loss of 200% of its initial credit OR if the trade has a profit of 50% of its initial credit OR 2 DTE.
  9. 200:75 - exit if the trade has a loss of 200% of its initial credit OR if the trade has a profit of 75% of its initial credit OR 2 DTE.
  10. 300:NA - exit if the trade has a loss of 300% of its initial credit OR 2 DTE.
  11. 300:50 - exit if the trade has a loss of 300% of its initial credit OR if the trade has a profit of 50% of its initial credit OR 2 DTE.
  12. 300:75 - exit if the trade has a loss of 300% of its initial credit OR if the trade has a profit of 75% of its initial credit OR 2 DTE.
For a given DTE, there will be 432 test runs (9 variations x 4 deltas x 12 exits).  As mentioned earlier, each test run will enter as many trades as possible that meet the entry criteria between the Jan-2007 expiration and the Sep-2016 expiration.  For a given DTE, this will result in the backtest of approximately 100,000 trades.  This process will take some time!


Follow my blog by email, RSS feed or Twitter (@DTRTrading).  All options are available on the top of the right hand navigation column under the headings "Subscribe To RSS Feed", "Follow By Email", and "Twitter".