Sunday, October 25, 2015

SPX Straddle - 73 DTE - Manage Profits at 10%

In this post we look at the backtest results of selling a one-lot, at-the-money (ATM) straddle on the S&P 500 Index (SPX), initiated at 73 days-to-expiration (DTE).  In this second post of five on 73 DTE straddles, we look at trades that use the same loss exits as shown in the first post, and in addition, take profits at 10% of the credit received.  The results displayed in this post represent data from 832 individual trades entered by the automated backtester.

For background on the setup for the backtests, as well as the nomenclature used in the charts and tables below, please see the introductory article for this series: Option Straddle Series - P&L Exits.

In the trade metrics tables, some of the metrics rows have been highlighted to indicate values that are in the upper half of the readings.  One of the metrics to note is the average P&L per day in percentage terms (P&L % / Trade - Avg. P&L / Day).  This is a measure of the P&L per day normalized to the maximum initial portfolio margin (initial PM) required for that trade run...it tells us the effectiveness of theta with respect to our margin requirement.  Also note that the y-axis scale is the same in all of the 73 DTE equity curves.


No IV Rank Filter

In this section we will look at the results of entering one trade for every monthly expiration regardless of the implied volatility rank (IVR) of the SPX on the date of entry.  Entering these trades at 73 DTE and utilizing our loss exits and 10% credit exits (described here), resulted in the equity curves below.  These equity curves look like a cross between the returns of the 59 DTE variations and the behavior of the 66 DTE variations.

SPX Short Options Straddle Equity Curves - 73 DTE - Risk:Reward 10% Exits
(click to enlarge)

The trade metrics for these different exits are shown in the table below.  Six of the eight variations have win rates of 92% or greater.  The (75:10) variation had the highest overall P&L % reading, highest P&L % per trade value, and a win rate of 92%.  There were other variations that had higher P&L % per day values and higher win rates, but lower metrics in other areas.

SPX Short Options Straddle Trade Metrics - 73 DTE - Risk:Reward 10% Exits
(click to enlarge)

The table below shows the distribution of returns in five-number summary format.  Hat-tip to tastytrade.

SPX Short Options Straddle 5 Number Summary - 73 DTE - Risk:Reward 10% Exits
(click to enlarge)

Below are three sets of scatter plots for selling 73 DTE ATM SPX straddles. The first image contains one scatter plot per strategy and shows P&L in percentage terms versus IVR for the SPX. The IVR was captured on the day each trade was initiated.  There is a trend of increasing P&L with increasing IVR, but it is not very clear because the y-axis scale.  This is the same y-axis scale used in the first post of this 73 DTE straddle series.

SPX Short Options Straddle Scatter Plot IV Rank versus P&L - 73 DTE - Risk:Reward 10% Exits
(click to enlarge)

The next image shows P&L in percentage terms versus initial ATM IV. This ATM IV was captured on the day each trade was initiated.  Higher IV resulted in higher returns, but the majority of all trades occurred at lower IV, below 40.  The bulk of the losing trades occurred at an IV below 35, but most of the winning trades occurred in this region as well.  Also, the number of losing trades in this region decreases as the loss taking threshold is increased.  At loss taking levels at and above 125%, the number of losing trades remains constant at 7.

SPX Short Options Straddle Scatter Plot IV versus P&L - 73 DTE - Risk:Reward 10% Exits
(click to enlarge)

The third image shows P&L in percentage terms versus days-in-trade (DIT).  When managing losses early (25%, 50%), the losses were fairly evenly distributed across DIT.  As the loss management becomes less aggressive (125%, 150%, 175%, and 200%), the loss thresholds were were rarely hit.  We still had losing trades, with losses realized at expiration...but these losses were mostly less than our threshold value at expiration.

SPX Short Options Straddle Scatter Plot DIT versus P&L - 73 DTE - Risk:Reward 10% Exits
(click to enlarge)


IV Rank > 50% Filter

In this section we look at the results of entering one trade for every monthly expiration only when the IVR of the SPX is greater than 50% ( >50% ).  Entering these trades at 73 DTE and utilizing our loss exits and 10% credit exits (described here) resulted in the equity curves below...not great...but better than some of the other 10% credit exit equity curves at other DTE.
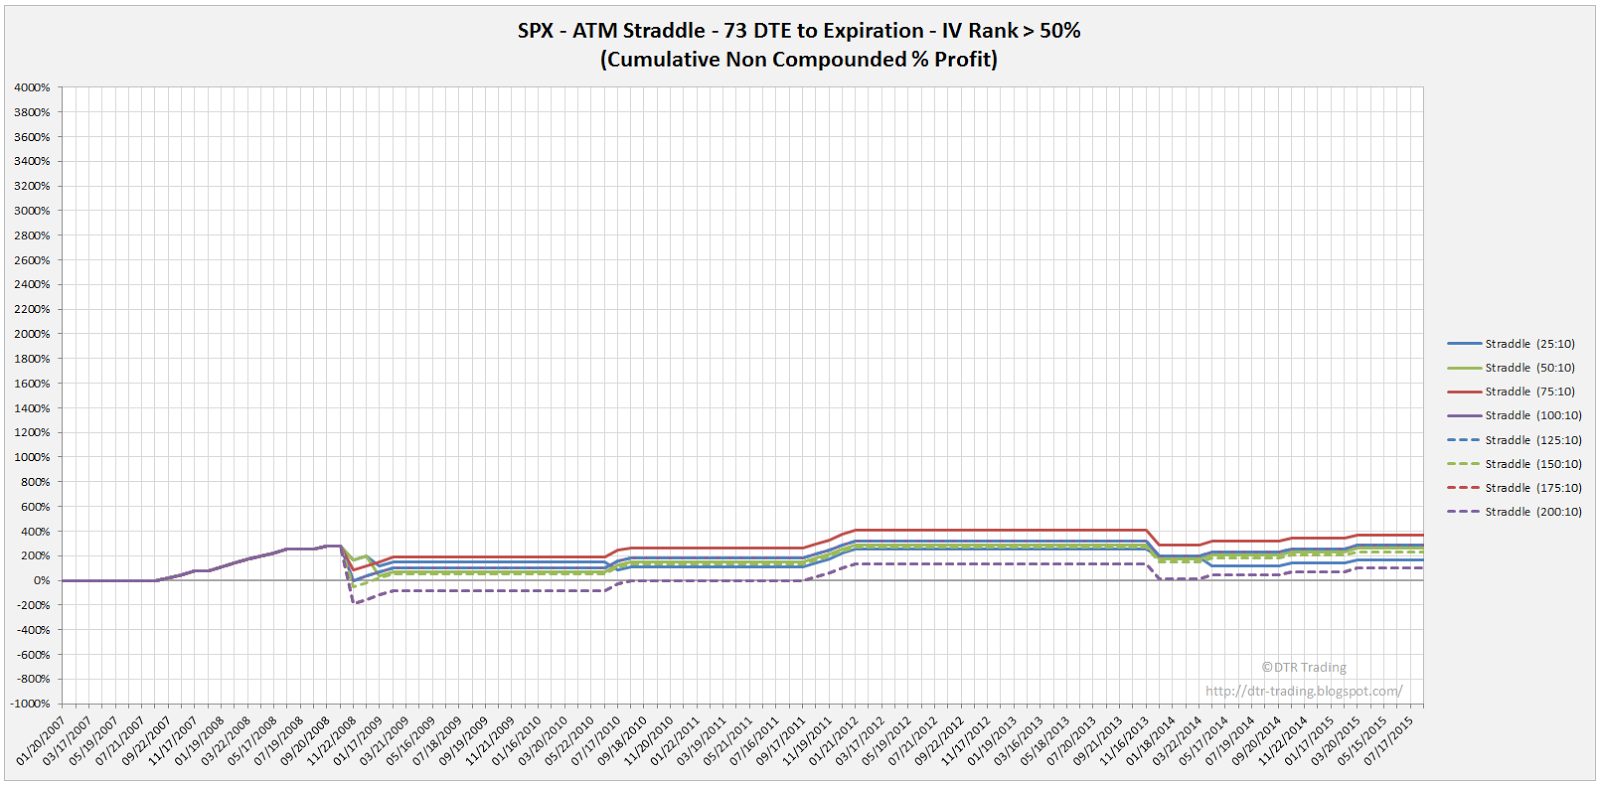
SPX Short Options Straddle Equity Curves - 73 DTE - IV Rank > 50 - Risk:Reward 10% Exits
(click to enlarge)

The trade metrics for these different exits are shown in the table below.  There are significantly fewer trades that meet the >50% IVR criteria...only 24 out of 104.  The win rate was solid (at 92%) for six of the eight variations, but the total P&L % numbers were very low.  The best performer of the group was the (75:10) variation.

SPX Short Options Straddle Trade Metrics - 73 DTE - IV Rank > 50 - Risk:Reward 10% Exits
(click to enlarge)

The table below shows the distribution of returns in five-number summary format.

SPX Short Options Straddle 5 Number Summary - 73 DTE - IV Rank > 50 - Risk:Reward 10% Exits
(click to enlarge)


IV Rank < 50% Filter

In this section we will look at the results of entering one trade for every monthly expiration only when the IVR of the SPX is less than 50% ( <50% ).  Entering these trades at 73 DTE and utilizing our loss exits and 10% credit exits (described here) resulted in the equity curves below...which look a bit better than the IVR > 50% equity curves.  These variations really started working in the last quarter of 2011.

SPX Short Options Straddle Equity Curves - 73 DTE - IV Rank < 50 - Risk:Reward 10% Exits
(click to enlarge)

The trade metrics for these different exits are shown in the table below.  Using the lower IVR filter resulted in trade metrics that were better than the non-IVR filtered and IVR > 50% strategy variations.  The (25:10) variation had the highest P&L readings per day, per trade, and overall.  In addition, it had the highest Sortino and Profit factor.  It had the lowest win rate, of 88%, of the group though.  The next best strategy was the (75:10) variation.

SPX Short Options Straddle Trade Metrics - 73 DTE - IV Rank < 50 - Risk:Reward 10% Exits
(click to enlarge)

The table below shows the distribution of returns in five-number summary format.

SPX Short Options Straddle 5 Number Summary - 73 DTE - IV Rank < 50 - Risk:Reward 10% Exits
(click to enlarge)

In the next post we will look at the backtest results of 73 DTE ATM SPX short straddles using the same loss thresholds as above, but with profit taking occurring at 25% of the credit received.


Follow my blog by email, RSS feed or Twitter (@DTRTrading).  All options are available on the top of the right hand navigation column under the headings "Subscribe To RSS Feed", "Follow By Email", and "Twitter".

Saturday, October 24, 2015

SPX Straddle - 73 DTE - No Profit Management

This post looks at the results of selling a one-lot straddle on the S&P 500 Index (SPX), initiated at 73 days-to-expiration (DTE).  This is the first post of five on 73 DTE straddles, and will only look at loss exits...the other four posts will explore different profit exits on top of the loss exits in this post.  The results displayed in this post represent data from 832 individual trades entered by the automated backtester.

For background on the setup for the automated backtests, as well as the nomenclature used in the charts and tables below, please see the introductory article for this series: Option Straddle Series - P&L Exits.

In the trade metrics tables, some of the metrics rows have been highlighted to indicate values that are in the upper half of the readings.  One of the metrics to note is the average P&L per day in percentage terms (P&L % / Trade - Avg. P&L / Day).  This is a measure of the P&L per day normalized to the maximum initial portfolio margin (initial PM) required for that trade run...it tells us the effectiveness of theta with respect to our margin requirement.  Also note that the y-axis scale is the same in all of the 73 DTE equity curves.


No IV Rank Filter

In this section we look at the results of entering one trade for every monthly expiration regardless of the implied volatility rank (IVR) of the SPX on the date of entry.  Entering these trades at 73 DTE and utilizing our loss exits (described here) resulted in the equity curves below.  Several of these equity curves look better than the prior 66 DTE curves, with less deep drops in the equity curves.  There is also an interesting trend here across all of the non-IVR filtered equity curves for all DTE...the steep up-trend during 2015.

SPX Short Options Straddle Equity Curves - 73 DTE - Risk:Reward Exits
(click to enlarge)

The trade metrics for the different exits are shown in the table below.  The best win rates for these variations (68%) are better than all of the prior DTE non-IVR filtered variations.  The total P&L % numbers are also the best we've seen for the non-IVR filtered variations.  The top performer in the table below was the (125:NA) variation.  As a reminder, these trades are either exited at expiration OR at the designated loss level.

SPX Short Options Straddle Trade Metrics - 73 DTE - Risk:Reward Exits
(click to enlarge)

The table below shows the distribution of returns in five-number summary format.  Hat-tip to tastytrade.

SPX Short Options Straddle 5 Number Summary - 73 DTE - Risk:Reward Exits
(click to enlarge)

Below are two images of scatter plots for selling 73 DTE ATM SPX straddles. The first image contains one scatter plot per strategy and shows P&L in percentage terms versus the IVR for the SPX. The IVR was captured on the day each trade was initiated.  The profitable trades follow a trajectory that curves up as IVR increases...the same pattern we've seen before.

SPX Short Options Straddle Scatter Plot IV Rank versus P&L - 73 DTE - Risk:Reward Exits
(click to enlarge)

The next image shows P&L in percentage terms versus initial ATM IV. This ATM IV was captured on the day each trade was initiated.  Most of the trades are clustered in the 10 to 30 IV region.

SPX Short Options Straddle Scatter Plot IV versus P&L - 73 DTE - Risk:Reward Exits
(click to enlarge)

Even without profit management or an IVR filter, approximately 65% of the trades were profitable at a loss management level of 75% or greater.  The trend of increasing IV yielding higher returns is not perceptible in these scatter plots.


IV Rank > 50% Filter

In this section we look at the results of entering one trade for every monthly expiration only when the IVR of the SPX is greater than 50% ( >50% ).  Entering these trades at 73 DTE and utilizing our loss exits (described here) resulted in the equity curves below.  As we've seen in my prior posts, the curves have long periods that are flat...these are times when no trades were taken due to the IVR being below the filter level.  This is a familiar pattern that we have seen with all of the trades using the IVR > 50% filter.

SPX Short Options Straddle Equity Curves - 73 DTE - IV Rank > 50 - Risk:Reward Exits
(click to enlarge)

The trade metrics for these different exits are shown in the table below.  These trades have better win rates, significantly better returns per day, and better returns per trade than the non-IVR filtered trades.   For the best performing variations, these latter two metrics were at least twice as good.  The total P&L% for these filtered trades was about half the total P&L% for the non-IVR filtered. The best performing variation in the group was the (75:NA) strategy.  Also note, that only a little more than 23% of the total trades satisfied the IVR filter of  > 50%.

SPX Short Options Straddle Trade Metrics - 73 DTE - IV Rank > 50 - Risk:Reward Exits
(click to enlarge)

The table below shows the distribution of returns in five-number summary format.

SPX Short Options Straddle 5 Number Summary - 73 DTE - IV Rank > 50 - Risk:Reward Exits
(click to enlarge)


IV Rank < 50% Filter
In this section we will look at the results of entering one trade for every monthly expiration only when the IVR of the SPX is less than 50% ( <50% ).  Entering these trades at 73 DTE and utilizing our loss exits (described here) resulted in the equity curves below.

SPX Short Options Straddle Equity Curves - 73 DTE - IV Rank < 50 - Risk:Reward Exits
(click to enlarge)

The trade metrics for these different exits are shown in the table below.  These trades have lower win rates and lower total P&L per day and P&L per trade numbers than the non-IVR and IVR > 50% filtered trades shown above.

SPX Short Options Straddle Trade Metrics - 73 DTE - IV Rank < 50 - Risk:Reward Exits
(click to enlarge)

The table below shows the distribution of returns in five-number summary format.

SPX Short Options Straddle 5 Number Summary - 73 DTE - IV Rank < 50 - Risk:Reward Exits
(click to enlarge)

Similar to the 66 DTE short straddles without profit management, the 73 DTE SPX short straddles performed reasonably well.  We now have our baseline for the 73 DTE strategies, so we can move on to the profit taking versions.

In the next post we will look at the automated backtest results of 73 DTE SPX short straddles using the same loss thresholds as above, but with profit taking occurring at 10% of the credit received.


Follow my blog by email, RSS feed or Twitter (@DTRTrading).  All options are available on the top of the right hand navigation column under the headings "Subscribe To RSS Feed", "Follow By Email", and "Twitter"